MarketTracker Bay Area - May 2025 from CharlieBrownSF

The Big Story
Quick Take:
Although affordability has been improving over the past few months, monthly P&I payments are still quite a bit higher than they were last year.
Despite political moves that some believe were designed to bring down interest rates, mortgage rates remain high, as the lending market prices in future uncertainty.
On a national level, inventories are increasing at a very rapid rate, while the number of homes sold has declined.
Over the past couple of months, the macroeconomic environment has been incredibly unpredictable, a trend which looks like it will continue over the coming months.
Note: You can find the charts & graphs for the Big Story at the end of the following section.
*National Association of REALTORS® data is released two months behind, so we estimate the most recent month's data when possible and appropriate.
Growth in median monthly P&I payments continues to outstrip inflation
For quite some time, we’ve seen monthly inflation readouts with figures in the 2-3% range. Despite the fact that inflation seems to be under wraps for now, the median monthly P&I payment has grown faster than inflation, with the most reading coming in at $2,113, representing a 3.94% increase on a year-over-year basis. This shows that there are still inflationary pressures at work in the housing market.
Factors contributing to this inflation will vary by market. Some markets have more of an issue on the supply side (i.e. higher construction/materials costs), while others have an issue with the demand side (i.e. more demand for homes than supply). It will be especially important to pay attention to this metric over the coming months to get a gauge of how inflation is impacting the housing market.
Mortgage rates remain high, despite looming economic uncertainty
Mortgage rates have remained high, in the mid to high-6% range for quite some time. Some believe that the recent trade war was being implemented in part to bring down interest rates. However, judging by recent commentary from the Fed, the trade war and the associated uncertainty, has only made Fed officials more cautious in utilizing the incredibly powerful economic tool that is the federal funds rate.
This means that we are probably going to see elevated mortgage rates for the foreseeable future, unless the economy takes a considerable turn for the worse. It is worth noting though, that according to the Fed’s “Dot Plot”, the majority of Federal Reserve officials predict the federal funds rate will be in the 3.75-4.00% range by the end of the year, and the 3.25-3.50% range in 2026.
Inventories continue to build across the country
The moves in sales and inventory that we’ve been seeing throughout California over the past few months have been echoed on a national scale. The nation as a whole has seen inventories build, as homes sit on the market for longer. Our most recent data point (April 2025), shows that inventory increased by 20.83% on a year-over-year basis, to 1,450,000. Meanwhile, existing home sales decreased by 3.38%, to 4,000,000.
Despite the growing backlog of inventory, median sale prices are still trending upward, with the median listing selling for $414,000, representing a 1.82% year-over-year increase. To add fuel to the fire, we’ve seen growing numbers of listings hitting the market, with the number of new listings hitting the market increasing by 7.19% on a year-over-year basis.
Ultimately though, this is just what we’re seeing at a national level. As we all know, real estate is an incredibly localized industry, so knowing what’s going on in your own market is pivotal. Below is our local lowdown, that outlines everything you need to know about what’s happening around you in your neighborhood and surrounding areas!
Big Story Data


The Local Lowdown
Growth in median monthly P&I payments continues to outstrip inflation
For quite some time, we’ve seen monthly inflation readouts with figures in the 2-3% range. Despite the fact that inflation seems to be under wraps for now, the median monthly P&I payment has grown faster than inflation, with the most reading coming in at $2,113, representing a 3.94% increase on a year-over-year basis. This shows that there are still inflationary pressures at work in the housing market.
Factors contributing to this inflation will vary by market. Some markets have more of an issue on the supply side (i.e. higher construction/materials costs), while others have an issue with the demand side (i.e. more demand for homes than supply). It will be especially important to pay attention to this metric over the coming months to get a gauge of how inflation is impacting the housing market.
Mortgage rates remain high, despite looming economic uncertainty
Mortgage rates have remained high, in the mid to high-6% range for quite some time. Some believe that the recent trade war was being implemented in part to bring down interest rates. However, judging by recent commentary from the Fed, the trade war and the associated uncertainty, has only made Fed officials more cautious in utilizing the incredibly powerful economic tool that is the federal funds rate.
This means that we are probably going to see elevated mortgage rates for the foreseeable future, unless the economy takes a considerable turn for the worse. It is worth noting though, that according to the Fed’s “Dot Plot”, the majority of Federal Reserve officials predict the federal funds rate will be in the 3.75-4.00% range by the end of the year, and the 3.25-3.50% range in 2026.
Inventories continue to build across the country
The moves in sales and inventory that we’ve been seeing throughout California over the past few months have been echoed on a national scale. The nation as a whole has seen inventories build, as homes sit on the market for longer. Our most recent data point (April 2025), shows that inventory increased by 20.83% on a year-over-year basis, to 1,450,000. Meanwhile, existing home sales decreased by 3.38%, to 4,000,000.
Despite the growing backlog of inventory, median sale prices are still trending upward, with the median listing selling for $414,000, representing a 1.82% year-over-year increase. To add fuel to the fire, we’ve seen growing numbers of listings hitting the market, with the number of new listings hitting the market increasing by 7.19% on a year-over-year basis.
Ultimately though, this is just what we’re seeing at a national level. As we all know, real estate is an incredibly localized industry, so knowing what’s going on in your own market is pivotal. Below is our local lowdown, that outlines everything you need to know about what’s happening around you in your neighborhood and surrounding areas!
What’s Moving: Sold Homes & Upcoming Listings in SF
Looking to buy or sell? Interview me for the job...
Call Charlie 415-722-3493.
San Francisco leads price growth while other regions cool
May showcased the Bay Area's increasingly divergent price trends. San Francisco demonstrated remarkable resilience with median single-family home prices surging 7.58% to $1,802,000 and condos jumping 8.26% to $1,298,000, reaching some of the highest levels seen in over two years. This contrasts sharply with Silicon Valley, where the nearly two-year growth streak finally broke. Santa Cruz and San Mateo Counties saw single-family home prices decline by 1.65% and 10.46% respectively, while Santa Clara County managed a modest 3.99% increase.
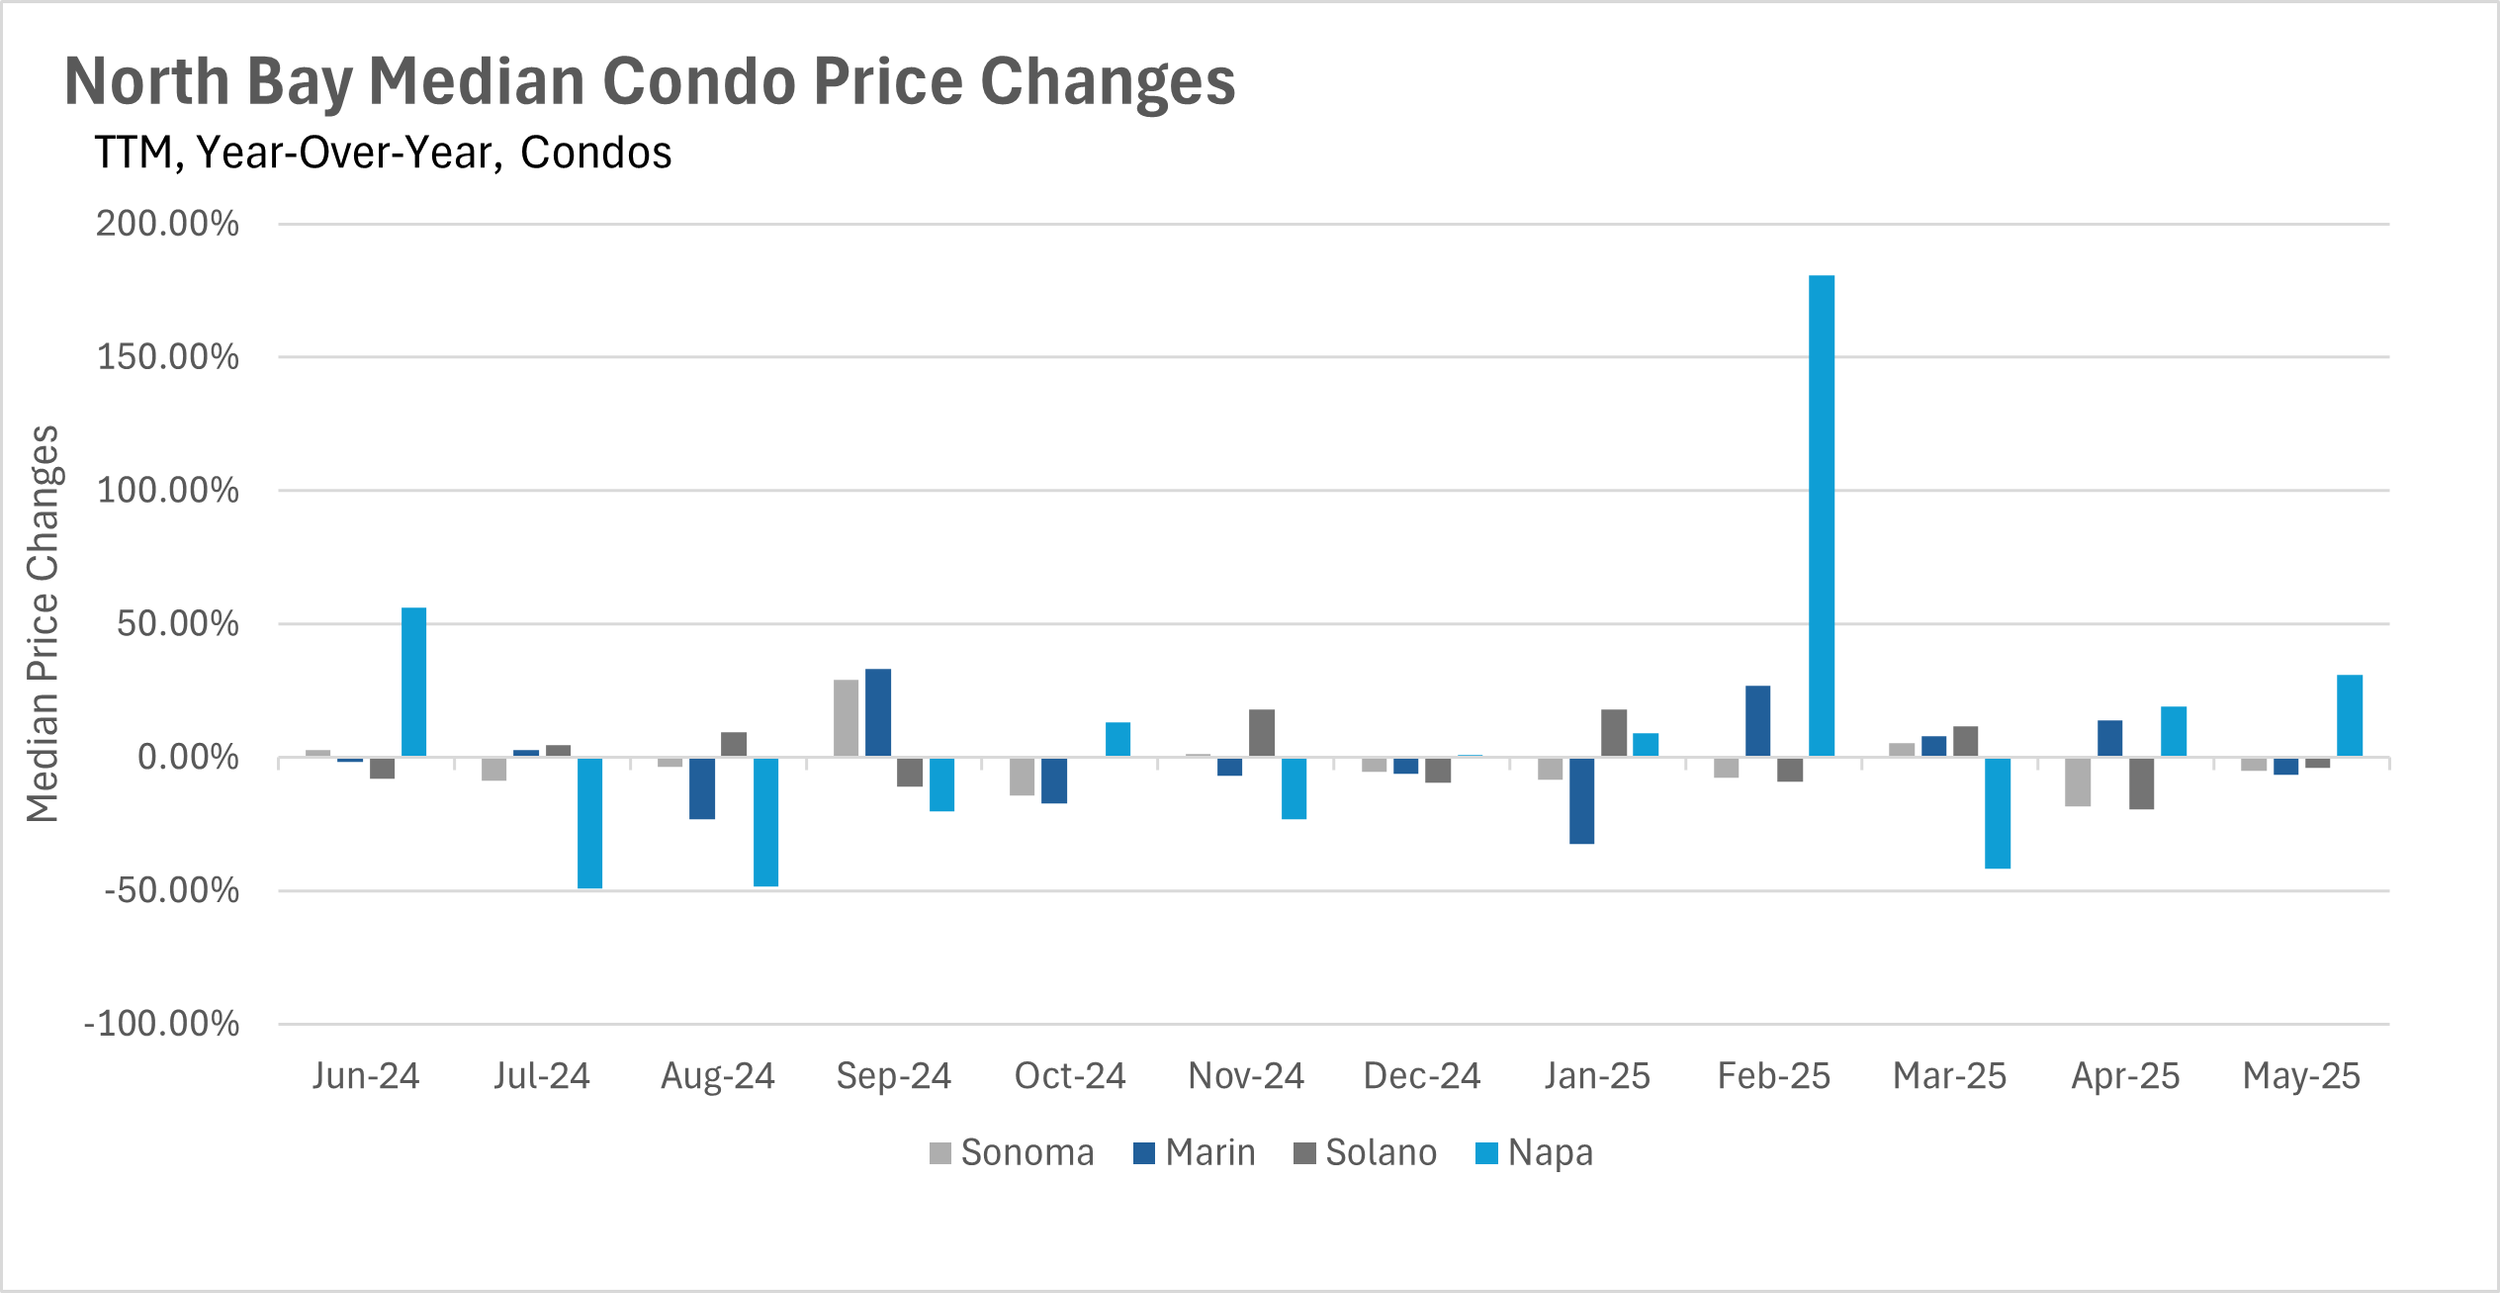
The condo market in Silicon Valley experienced even steeper declines, dropping 14.88% in San Mateo, 3.19% in Santa Clara, and 9.71% in Santa Cruz. Meanwhile, the North Bay showed widespread price weakness, with Napa County experiencing a dramatic 12.03% decline, while Solano and Sonoma Counties saw more modest decreases of 2.93% and 2.52%. Only Marin County bucked the trend with a 2.72% increase. The East Bay proved most resilient with minimal price movement, just 0.01% down in Contra Costa County and 1.46% down in Alameda County for single-family homes, though condos faced significant pressure with Alameda down 16.43%.
Inventory trends create a tale of two markets
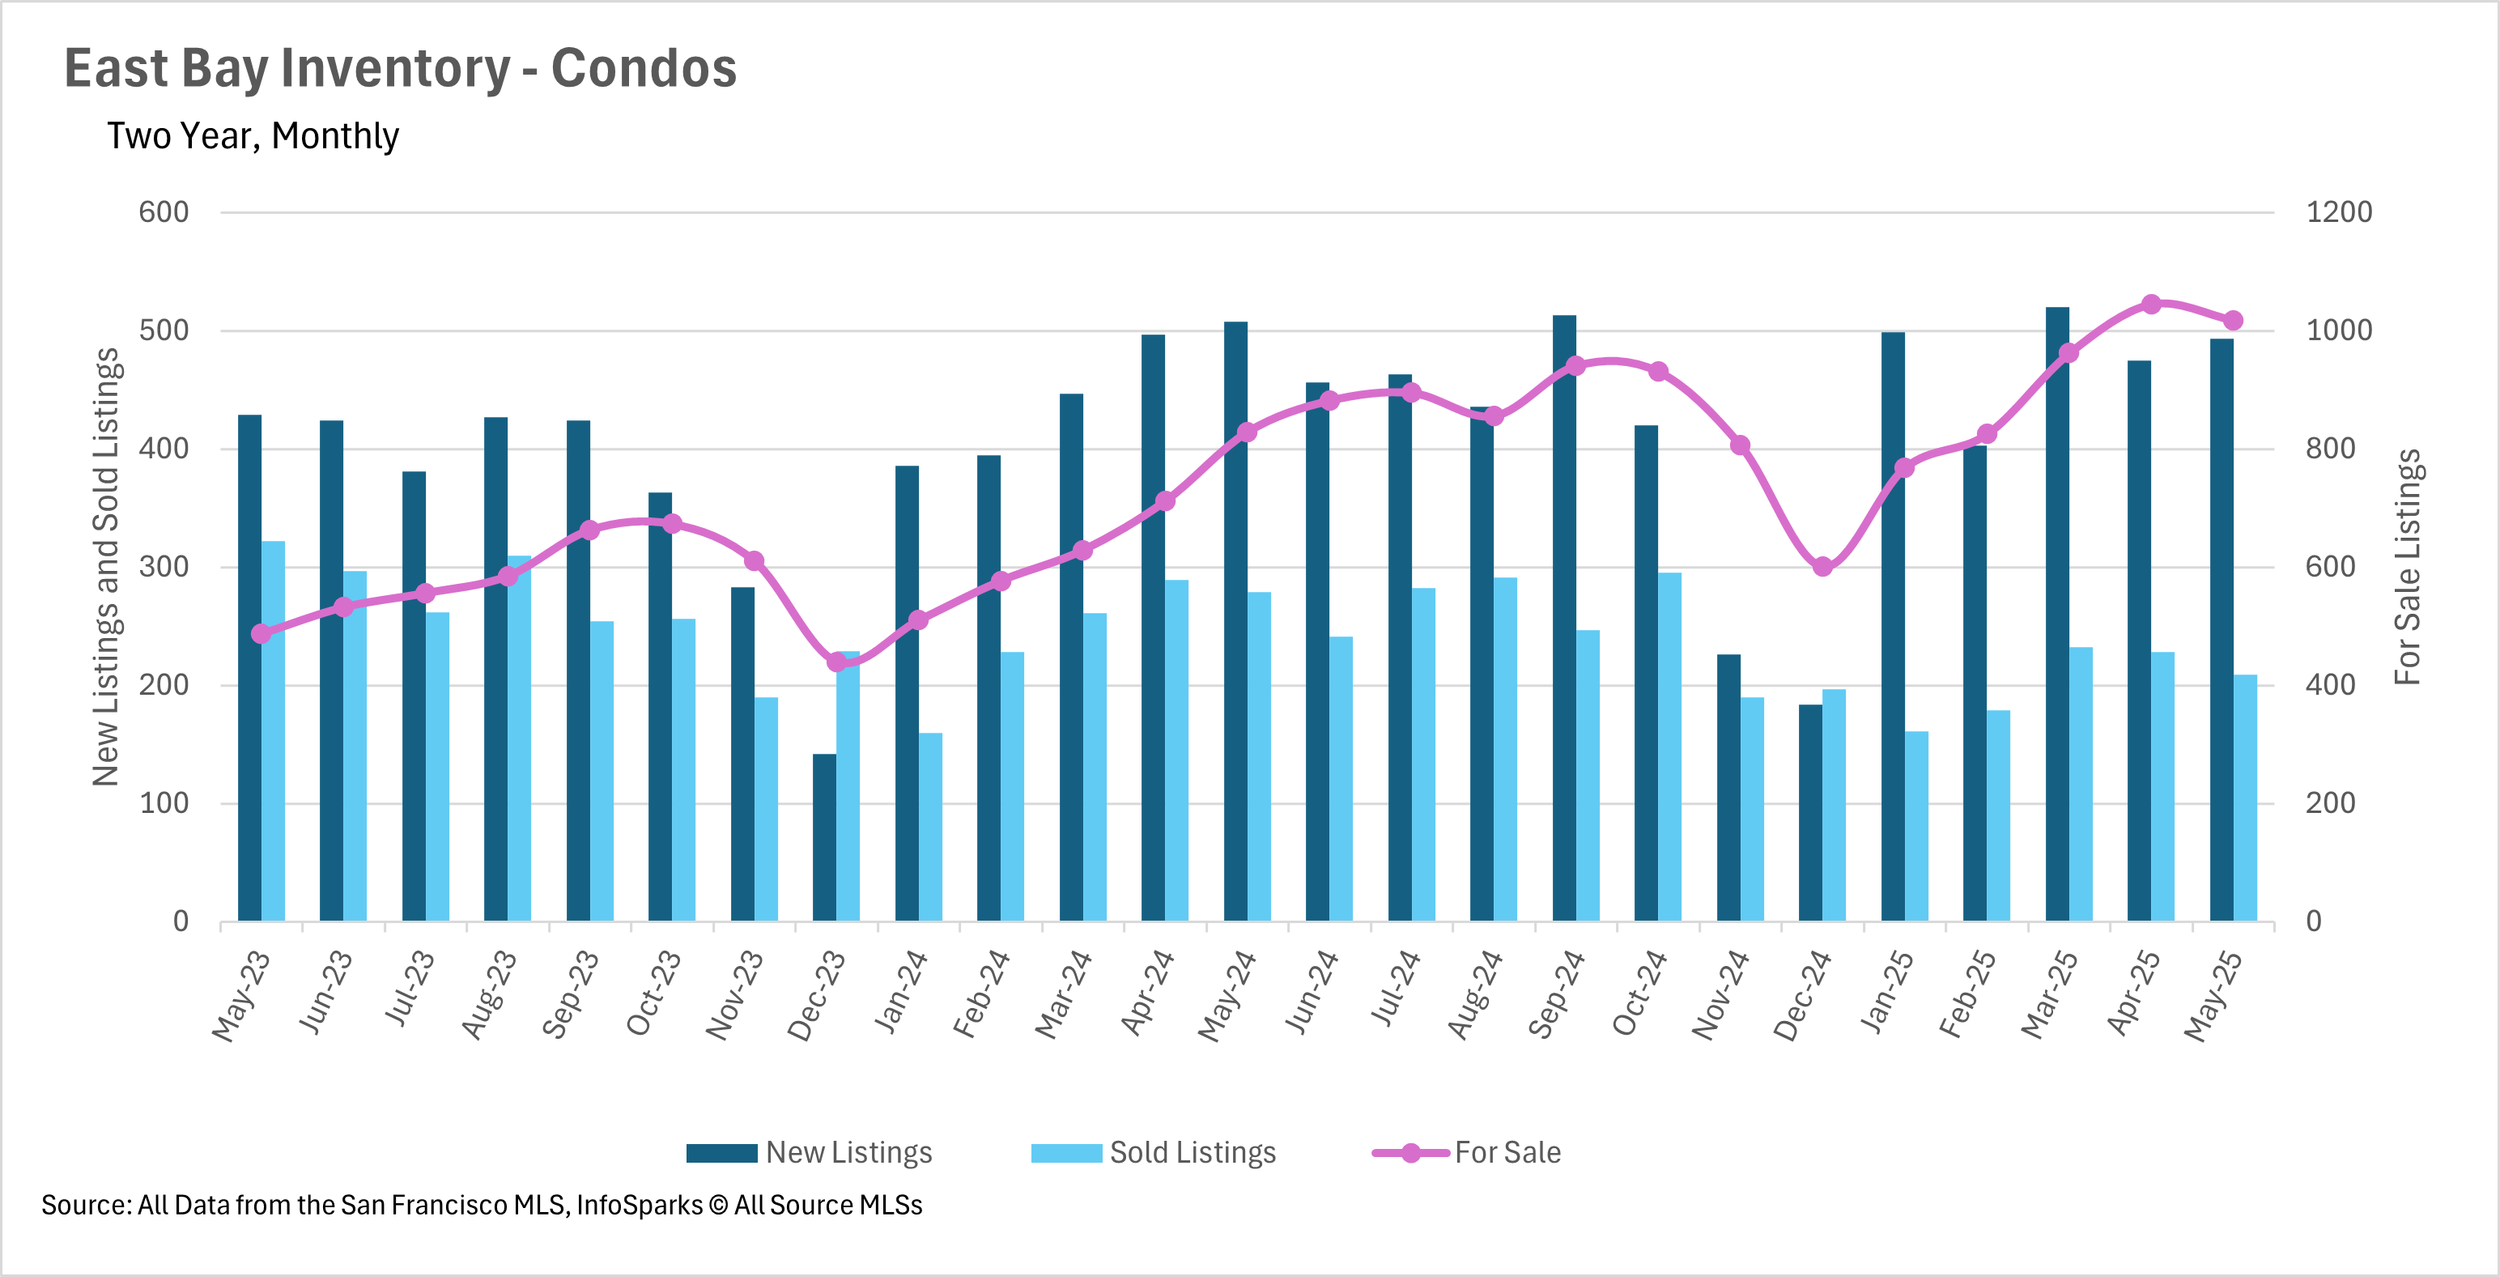
May revealed stark inventory contrasts across the Bay Area. The East Bay and Silicon Valley experienced massive inventory buildups, with East Bay single-family home inventories reaching new two-year highs, increasing 31.42% year-over-year, while condo inventories grew 22.80%. Silicon Valley similarly set new records with single-family inventories jumping 21.65% and condo inventories surging 34.80%. Both regions attributed this to fewer sales rather than more listings, East Bay saw 15.57% fewer single-family home sales and 25.09% fewer condo sales, while Silicon Valley experienced 13.01% fewer single-family sales and 22.82% fewer condo sales.
In dramatic contrast, San Francisco continued its multi-year inventory decline with single-family homes down 2.54% and condos falling 14.01% year-over-year. The North Bay also saw sharp inventory declines, with single-family home listings dropping 10.74% and new listings decreasing roughly 30% across both single-family homes and condos. This created a bifurcated Bay Area market where inventory abundance in some regions coincided with severe shortages in others.
Days on market reveal regional buyer behavior patterns
The time properties spend on market varies dramatically across the Bay Area, revealing distinct buyer behavior patterns. San Francisco maintains the fastest-moving market, with single-family homes selling in just 13 days (unchanged from last year) and condos moving in 23 days (a significant improvement from 31 days last May). The East Bay also shows quick movement despite inventory increases, with single-family homes averaging just 14 days on market, though this represents a 40% increase from last year.
Silicon Valley single-family homes remain within their long-term averages for market time, but condos are experiencing significant delays, spending 46.15% more days on market in Santa Clara, 111.11% more in Santa Cruz, and 146.15% more in San Mateo Counties compared to last year. The North Bay shows the most consistent pattern of longer market times, with single-family homes spending 5 more days on market in Sonoma County and 2 more days in Marin, Solano, and Napa Counties year-over-year. These patterns suggest that while single-family homes continue to move relatively quickly throughout most of the Bay Area, the condo market is experiencing a fundamental shift toward longer selling periods, particularly in Silicon Valley.
Market dynamics increasingly favor property type over location
The months of supply inventory (MSI) metric reveals a consistent pattern across the Bay Area that transcends regional boundaries: single-family homes generally remain in seller's market territory while condos increasingly favor buyers. San Francisco exemplifies this split with single-family homes at just 1.8 months of supply (down 14.29% year-over-year) while condos sit at 3.8 months (down 22.45% but still favoring buyers). Silicon Valley has largely become a buyer's market, with all three counties showing buyer-favorable condo markets (4 months in San Mateo, 3.3 in Santa Clara, and 5.8 in Santa Cruz). However, Santa Cruz County's single-family market has shifted to favor buyers with 4.3 months of supply, while San Mateo (2 months) and Santa Clara (1.7 months) remain seller's markets.
The East Bay continues its divided pattern with single-family homes at 2.3 months in Alameda and 2.8 months in Contra Costa (seller's markets), while condos favor buyers with 4.8 and 3.9 months respectively. The North Bay shows the most variation, with only Solano County (2.5 months) remaining a seller's market, Marin balanced at exactly 3 months, and Sonoma (3.5 months) and Napa (7 months) firmly in buyer's territory. This pattern suggests that across the Bay Area, single-family homes retain their premium status and seller advantage, while the condo market presents increasingly attractive opportunities for buyers willing to navigate longer search and closing timelines.