MarketTracker Bay Area - July 2025 from CharlieBrownSF

The Big Story
Quick Take:
Affordability remains an issue nationwide, as the median monthly P&I payment ticked up by 10.15% on a year-over-year basis at the end of April.
Mortgage rates have continued to hold the mid-six percent range that we’ve seen for over six months.
Inventories continue to climb throughout the country, while home sales start to slow down.
The recent global economic and geopolitical instability that we’ve seen likely won’t help the market, as uncertainty may lead people to stay where they are.
Note: You can find the charts & graphs for the Big Story at the end of the following section.
*National Association of REALTORS® data is released two months behind, so we estimate the most recent month's data when possible and appropriate..
The housing affordability issue continues to grow
As we all know, housing affordability has been a problem on a national scale for quite a few years at this point. At this point in time, many find it hard to believe that the housing market will return to pre-pandemic levels in terms of affordability at any point in the near future. Unfortunately, things have not gotten much better, as the median monthly P&I payment increased by 10.15% on a year-over-year basis, to $2,182 in the month of April. This jump in P&I payment represents a drastic month-over-month jump of 3.46%. This jump is actually quite perplexing, as median home sale prices have increased by 1.34% on a year-over-year basis, while mortgage rates have actually come down.
Mortgage rates remain stagnant in the mid-six percent range
For the past few months, mortgage rates have remained fairly stable, in the mid-six percent range. Although the stability that we’ve seen is a good thing, the levels they’ve stabilized at are quite a bit higher than recent historical averages. This, of course, is one of the leading causes of the affordability issues that we’ve seen recently.
It is worth noting, though, that we might see some discounted rates toward the back half of the year. Although the Fed has not touched the federal funds rate in nearly a year, the Fed chairman has signaled that one to two rate cuts are expected by the end of the year, so long as there aren’t any further spikes in inflation.
Inventories are building at an incredibly rapid rate
What we have been seeing in terms of inventories in California has been echoed on a nationwide scale. Fewer homes are being sold, with 1.95% fewer existing home sales when compared to this time last year. At the same time, 9.95% more new listings have hit the market on a year-over-year basis. This has led overall inventory to increase by a whopping 20.31% on a year-over-year basis.
As inventories are piling up, negotiating power will slowly shift from the sellers to the buyers, as buyers have more opportunities, and don’t need to move nearly as quickly as they had to just a year earlier.
Global economic and geopolitical instability are making both buyers and sellers more cautious
In any market, but especially the real estate market, instability is incredibly detrimental. Given the recent rise in uncertainty around tariffs and employment, coupled with continued instability in Europe and the Middle East, both buyers and sellers have become much more cautious. Inventories are growing throughout California and the broader United States. However, for those who have the capital and a long time horizon, times like these can represent excellent buying opportunities, as good deals are easier to come by.
However, it’s important to note that this is just what we have been seeing at the national level. California markets have largely remained resilient, which we’ll delve into more in the local lowdown section below.
Big Story Data


What’s Moving: Sold Homes & Upcoming Listings in SF
Looking to buy or sell? Interview me for the job...
Call Charlie 415-722-3493.
The Local Lowdown
Quick Take:
The Bay Area real estate market in June shows a clear bifurcation between San Francisco's surging prices and widespread declines in other regions' condo markets.
Inventory levels have reached local peaks across most regions and are beginning to decline, with the sharpest drawdowns occurring in the North Bay and San Francisco.
Despite inventory reductions, listings are spending significantly more time on the market throughout the Bay Area, with condos experiencing particularly dramatic increases in market time.
The market continues to strongly favor single-family homes over condos, with the condo market presenting substantial opportunities for buyers across all regions.
Note: You can find the charts/graphs for the Local Lowdown at the end of this section.
San Francisco leads price appreciation while condo markets struggle regionwide
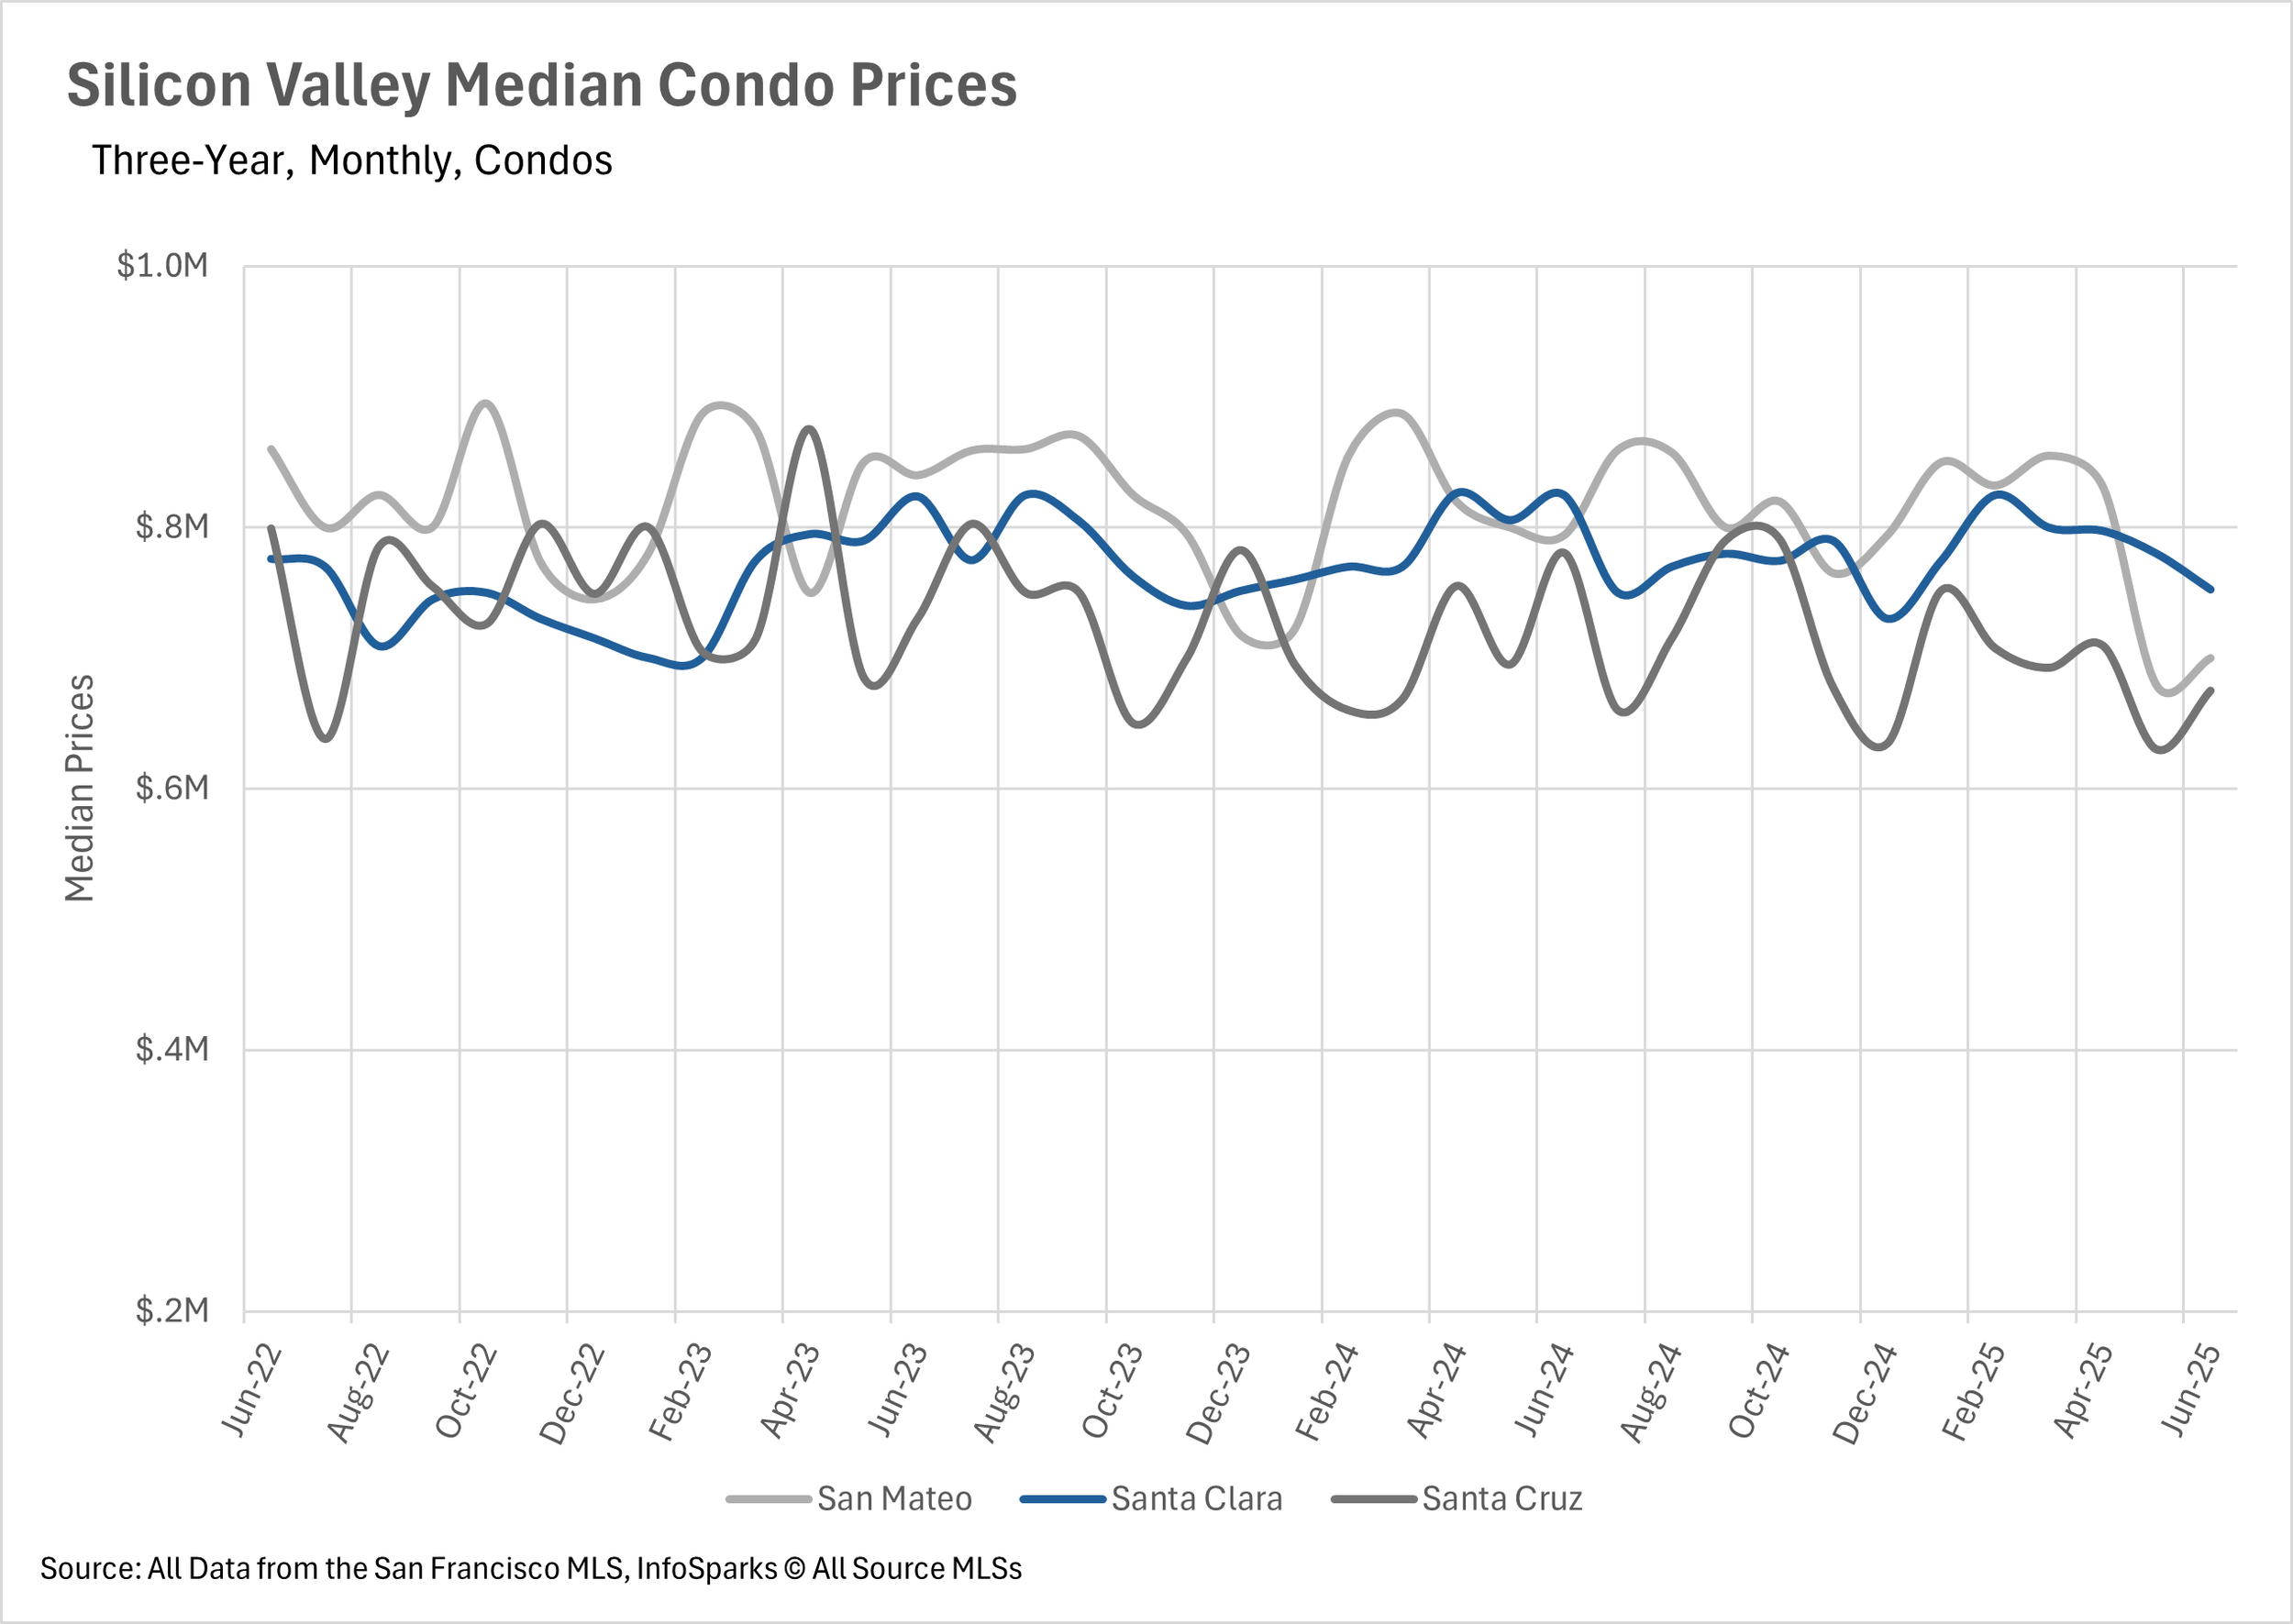
June showcased San Francisco's continued dominance in the Bay Area real estate market, with single-family home prices rising 4.42% year-over-year and condos surging an impressive 10.52% - marking over a year of consistent growth. This stands in stark contrast to the broader Bay Area, where condo markets are experiencing significant stress. The East Bay recorded its fifth consecutive month of year-over-year condo price declines, with condos down 11.41% in Alameda County and 8.25% in Contra Costa County. Silicon Valley's condo market also continued its downward trajectory for the third straight month, with Santa Clara County down 8.79%, San Mateo County declining 11.84%, and Santa Cruz County experiencing a dramatic 13.52% drop.
The North Bay showed the most stability in single-family homes, with Sonoma County up 2.92% and Napa County rising 5.60%, though Solano and Marin Counties saw declines of 5.23% and 5.35% respectively. Single-family homes in Silicon Valley demonstrated resilience with San Mateo and Santa Clara Counties posting gains of 3.21% and 7.18%, while only Santa Cruz County declined by 4.64%. The East Bay's single-family market showed mixed results with Contra Costa County managing a modest 1.99% increase while Alameda County continued its five-month decline.
Regional inventory trends reveal market consolidation
June marked a significant shift in inventory dynamics across the Bay Area, with most regions experiencing substantial month-over-month declines after reaching local peaks in May. The North Bay witnessed one of the sharpest inventory declines in recent history, with single-family home inventory falling 19.34% month-over-month (though still down only 7.09% year-over-year) and condo inventory dropping 19.76% month-over-month. San Francisco continued its multi-year inventory decline trend with single-family homes down 7.87% year-over-year and condos showing an even steeper 18.77% decline.
Silicon Valley and the East Bay appear to have reached their inventory peaks, with both regions seeing decreases in June despite maintaining significantly higher levels than last year. The East Bay still shows single-family inventory 20.05% higher year-over-year and condo inventory 13.15% higher, while Silicon Valley maintains 14.18% more single-family listings and 24.89% more condo listings than June 2024. The common thread across all regions is that inventory declines are being driven more by fewer new listings hitting the market rather than increased sales activity, suggesting seller hesitancy rather than buyer demand.
Days on market increase dramatically despite inventory declines
One of the most striking trends in June was the significant increase in days on market across all Bay Area regions, despite the substantial inventory declines. The North Bay saw the most consistent pattern with single-family homes spending 21.43% longer on market in Sonoma County, 25% longer in Marin County, 30.77% longer in Solano County, and 16.67% longer in Napa County year-over-year. Silicon Valley's condo market experienced the most dramatic increases, with Santa Cruz County condos spending 245.45% more time on market, San Mateo County condos up 116.67%, and Santa Clara County condos increasing 83.33%.
Even San Francisco, typically the Bay Area's fastest-moving market, saw single-family homes take 14 days on average (down 6.67% from last year) while condos remained flat at 31 days. The East Bay showed more modest but still significant increases of 25-35% more time on market year-over-year, though absolute numbers remained relatively quick with single-family homes selling in 15-17 days and condos in 25-31 days. This pattern suggests that while inventory is declining, buyer selectivity is increasing, creating a more deliberate purchasing environment.
Market dynamics increasingly favor property type over geography
The months of supply inventory metric reveals a consistent Bay Area-wide pattern where single-family homes remain in seller's market territory while condos have shifted decisively toward buyer's markets. San Francisco exemplifies this trend with single-family homes at just 1.5 months of supply (strong seller's market) while condos sit at 3.5 months (buyer's market). Silicon Valley shows San Mateo and Santa Clara Counties maintaining seller's markets for single-family homes at 1.9 and 1.7 months respectively, while all three Silicon Valley counties present buyer's markets for condos ranging from 3.4 to 5.5 months of supply.
The East Bay maintains its traditional split with single-family homes at 2.3 months in Alameda and 2.8 months in Contra Costa (seller's markets), while condos favor buyers with 4.7 and 3.9 months respectively. The North Bay shows the most variation, with Marin and Solano Counties approaching balanced markets for single-family homes at 2.8 and 2.9 months, while Sonoma (3.7 months) and Napa (7 months) favor buyers. However, all North Bay counties present buyer's markets for condos, with Napa County showing an extreme 8.1 months of condo supply. This pattern suggests that across the Bay Area, single-family homes retain their premium status and seller advantage, while the condo market presents increasingly attractive opportunities for buyers willing to navigate longer timelines and more inventory choices.