MarketTracker Silicon Valley - November 2025 from CharlieBrownSF

The Big Story
Quick Take:
Housing is slowly becoming more affordable, as interest rates slowly creep down over time.
As of the time this is written, the average 30-year mortgage rate is 6.22%, representing a drastic decline from earlier this year.
Inventory levels are holding steady, despite slight increases in transaction volume.
According to the CME FedWatch tool, we’re looking at a 65% chance that the Fed cuts rates by another quarter point in their December meeting.
Note: You can find the charts & graphs for the Big Story at the end of the following section.
*National Association of REALTORS® data is released two months behind, so we estimate the most recent month's data when possible and appropriate.
Housing payments have become slightly more affordable as interest rates tick down
Median monthly P&I payments are on the decline, as one might expect when interest rates are falling. This, of course, is great for new buyers that are in the market for a home. If we see an influx of new buyers, there is the possibility that we might see a less stagnant market when the spring time rush comes in early 2026. Unfortunately though, interest rates are still much too high for many people who locked in rates in the 2-3% range to justify moving to a new home and taking on a considerably higher mortgage payment each month. We likely won’t see these homes/homeowners enter the market until rates come down substantially more than they already have.
The Fed announced yet another quarter point cut to the federal funds rate
In the Fed’s October FOMC meeting, they decided to cut the federal funds rate by another quarter point, making the overnight interest rate range between 3.75% and 4.00%. This led mortgage rates to fall in unison, which is great news for prospective buyers and recent buyers that made the bet that they would be able to refinance at a lower rate sooner rather than later. It’ll be important to look at the economic data that’s released once the government shutdown ends, as this data is what the Fed bases their interest rate decisions on. Once we receive some more clarity regarding economic data, then we’ll have a better idea of whether or not to expect a rate cut in December.
Inventories remain strong despite an increase in transaction volume
Inventories have remained incredibly strong throughout this year, as inventory growth has consistently outstripped existing home sale growth. This past month, we saw inventories grow by 13.97% on a year-over-year basis, while there were only 6.01% more existing homes sold. It’ll be interesting to see where inventories go over the course of the winter, since they usually decline meaningfully.
We may have another rate cut in the not-so-distant future
As we mentioned above, we might have another rate cut ahead of us, as CME’s FedWatch predicts a 65% chance of a 25 basis point rate cut in the Fed’s December meeting. However, it is worth noting that once the government shutdown-related “economic data moratorium” that we’ve been facing is lifted, this probability can shift very rapidly. If economic data is considerably better or worse than anticipated, then this may change how the Fed looks at the cutting cycle that we’re currently in. This means it’ll be very important to keep your eye out for key inflation and labor data once it eventually comes out.
All of this is just what we’re seeing at a national level, though. As we all know, real estate is incredibly localized, which is why you should take a look at your local lowdown below:
Big Story Data


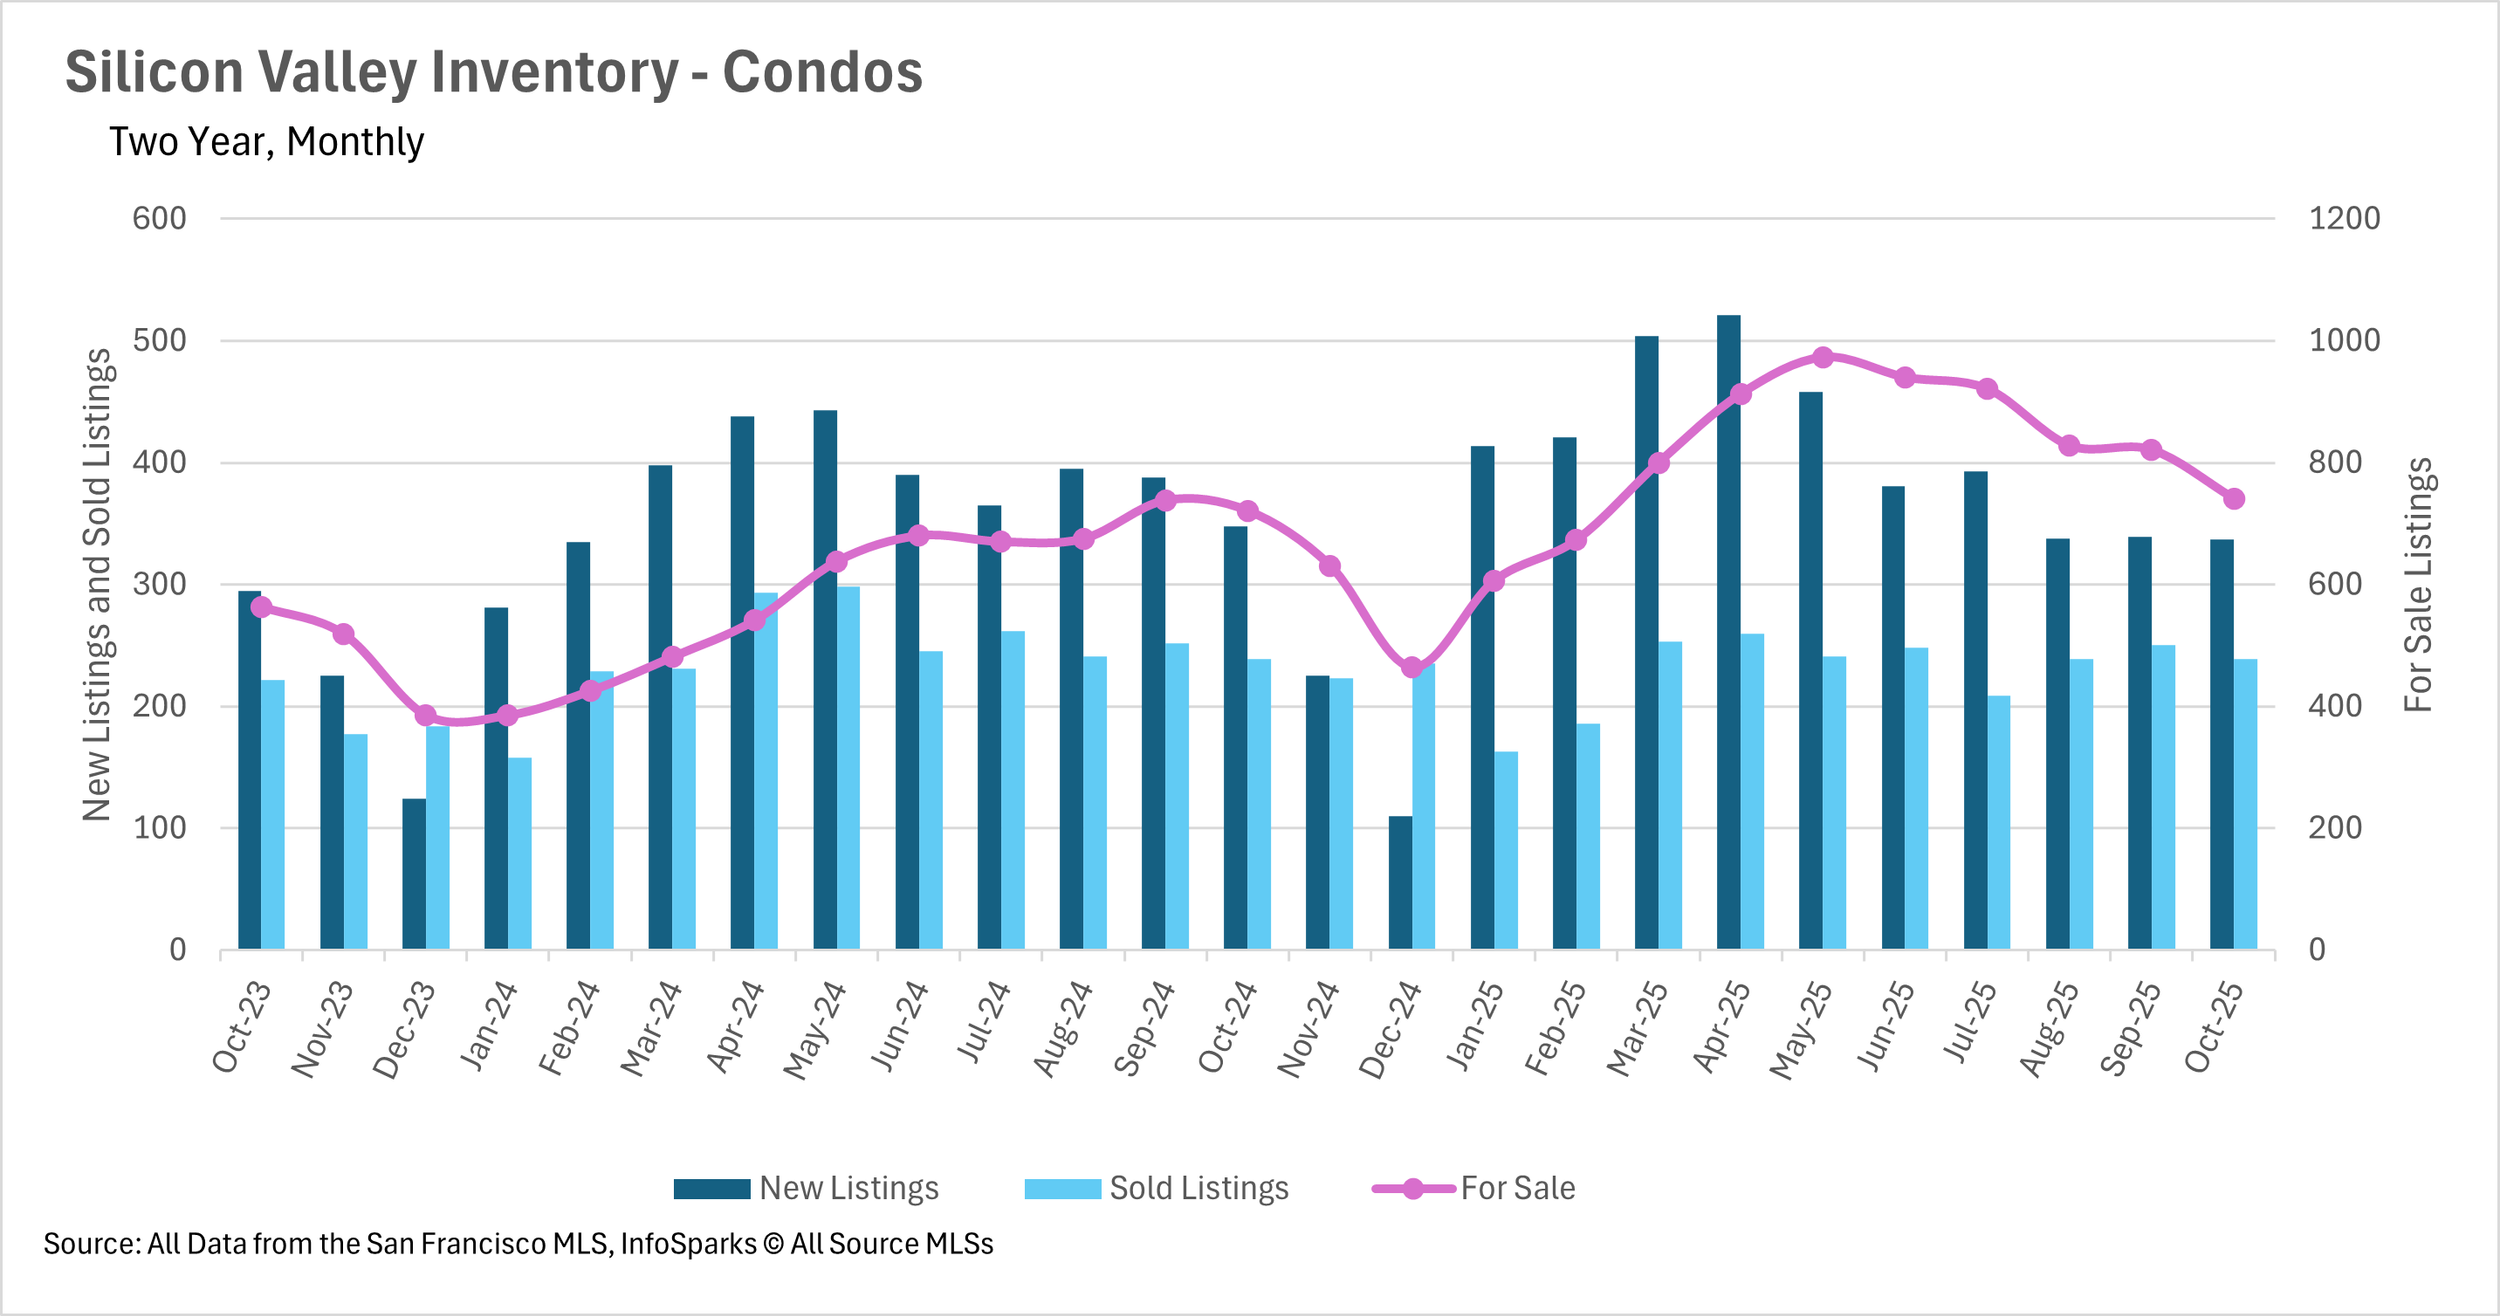
The Local Lowdown
Quick Take:
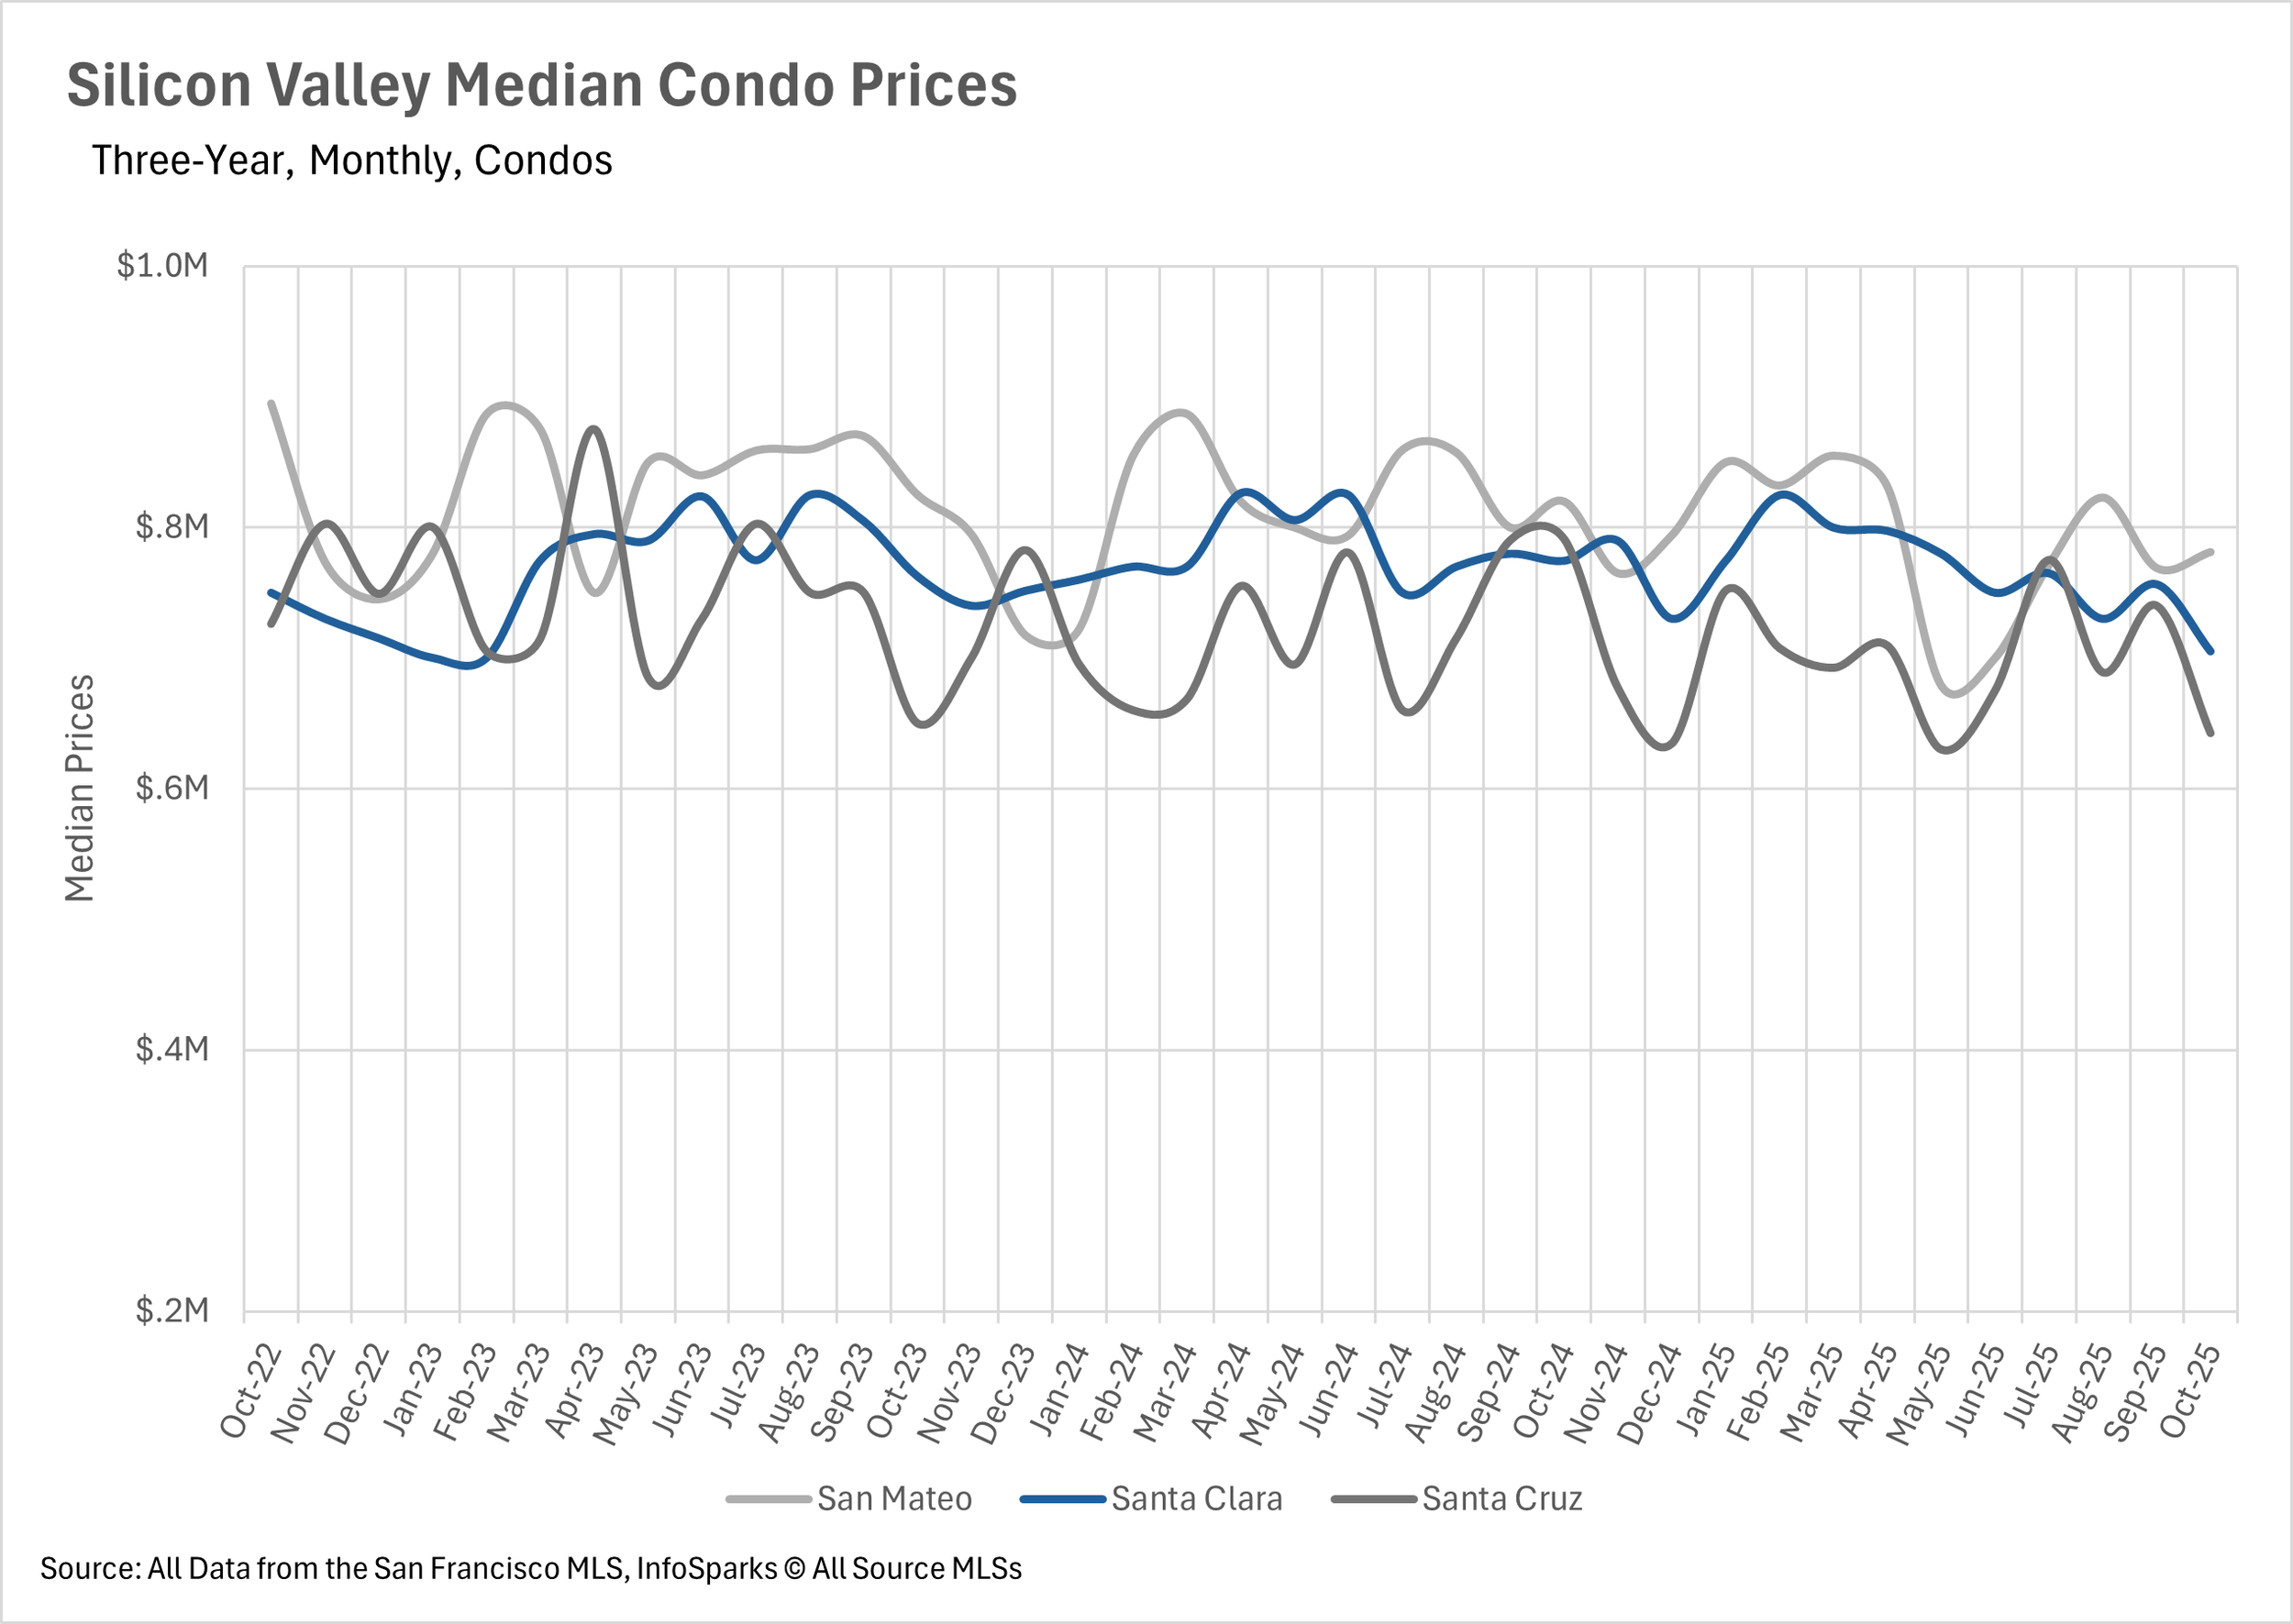
Median sale prices for condos fell precipitously in Silicon Valley this month.
Inventory levels have overcorrected and are now lower than they were last year.
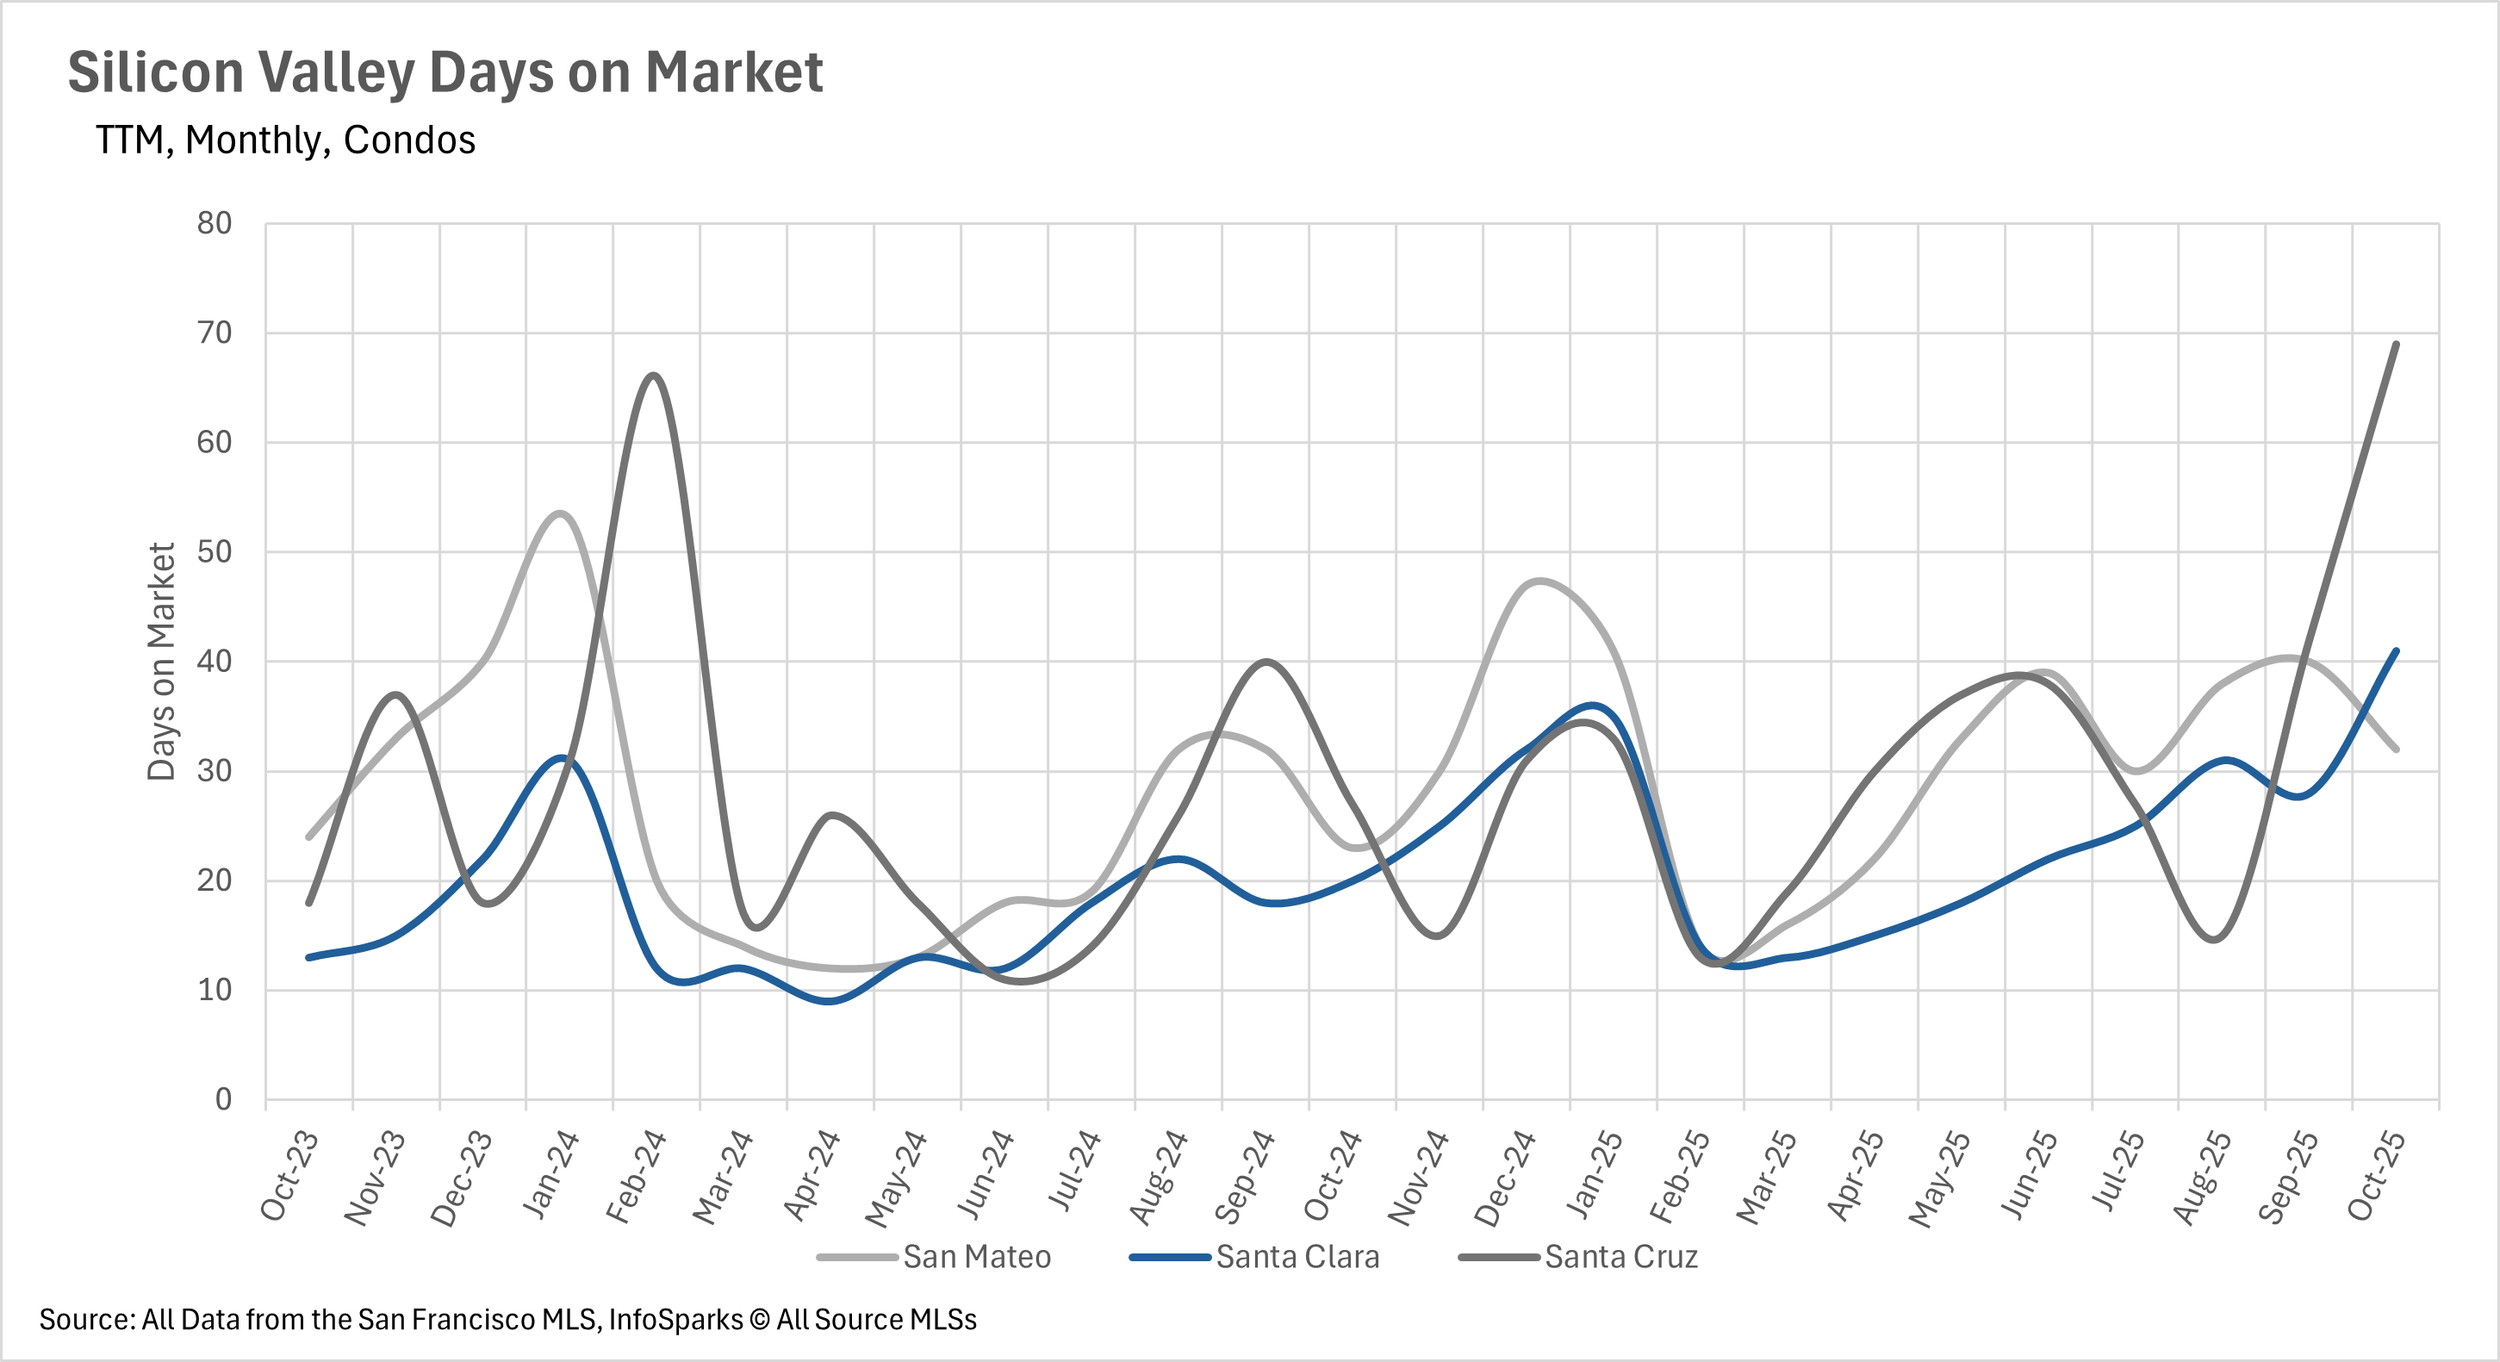
Listings are spending much more time on the market than this time last year.
Note: You can find the charts/graphs for the Local Lowdown at the end of this section.
Condo median sale prices fell once again
Last month, median sale prices for single-family homes were fairly stable, as they traded roughly within the band that they typically sell for. We saw the median single family in San Mateo County sell for 5.26% more than it did last year, while median single-family homes in Santa Clara and Santa Cruz Counties sold for 2.42% and 3.33% less than they did last year. However, last month the condo market was much more volatile, as condo prices decreased year-over-year throughout Silicon Valley. The median listings in San Mateo, Santa Clara, and Santa Cruz Counties sold for 4.73%, 8.97%, and 18.77% less than they did around this time last year!
The inventory overcorrection
Like much of the rest of the state of California (and the broader country), inventories increased pretty dramatically in Silicon Valley throughout much of 2025. However, we’ve seen quite the reversal of this trend in the single-family home market. The single-family home market in Silicon Valley closed out the month of October with 8.72% fewer active listings than it had just one year ago, and 15.22% fewer active listings than the prior month. Much of this move can be attributed to the fact that there were 5.89% fewer new listings hitting the market, with roughly the same number of listings sold on a year-over-year basis. The condo market is also seeing this correction, although not nearly as drastically, with there currently being 2.77% more active condo listings when compared to last year.
Most condos spend more than twice as much time on the market?
Although we saw some pretty drastic moves on a percentage basis in the single-family home market in terms of average days on market, single-family listings are still moving relatively quickly. The average single-family home in San Mateo and Santa Clara Counties spends 13 and 12 days on the market, respectively. However, the average Santa Cruz County single-family home listing is spending 32 days on the market, representing a 52.38% year-over-year increase. When we turn to the condo market, we see a much different picture being painted, though. San Mateo condos are spending 32 days on the market, representing a 39.13% increase, and Santa Clara and Santa Cruz County condos are spending more than twice as much time on the market as they did last year, with it taking 41 and 69 days for the average listing to sell, respectively. This represents a 105% and a 155.56% year-over-year increase!
The single-family home market remains incredibly competitive
When determining whether a market is a buyers’ market or a sellers’ market, we look to the Months of Supply Inventory (MSI) metric. The state of California has historically averaged around three months of MSI, so any area with at or around three months of MSI is considered a balanced market. Any market that has lower than three months of MSI is considered a sellers’ market, whereas markets with more than three months of MSI are considered buyers’ markets.
As per usual, the single-family home market is incredibly competitive, with San Mateo and Santa Clara Counties having 1.5 and 1.3 months of supply on the market respectively. Santa Cruz County is creeping back toward balanced territory with 3.5 months of supply on the market. When we turn to the condo market, Santa Clara and Santa Cruz Counties are buyers markets, with 3.2 and 4.2 months of supply on the market, respectively. On the other hand, San Mateo County has become more balanced, with exactly 3 months of supply on the market.