MarketTracker Silicon Valley - January 2026 from CharlieBrownSF

Quick Take:
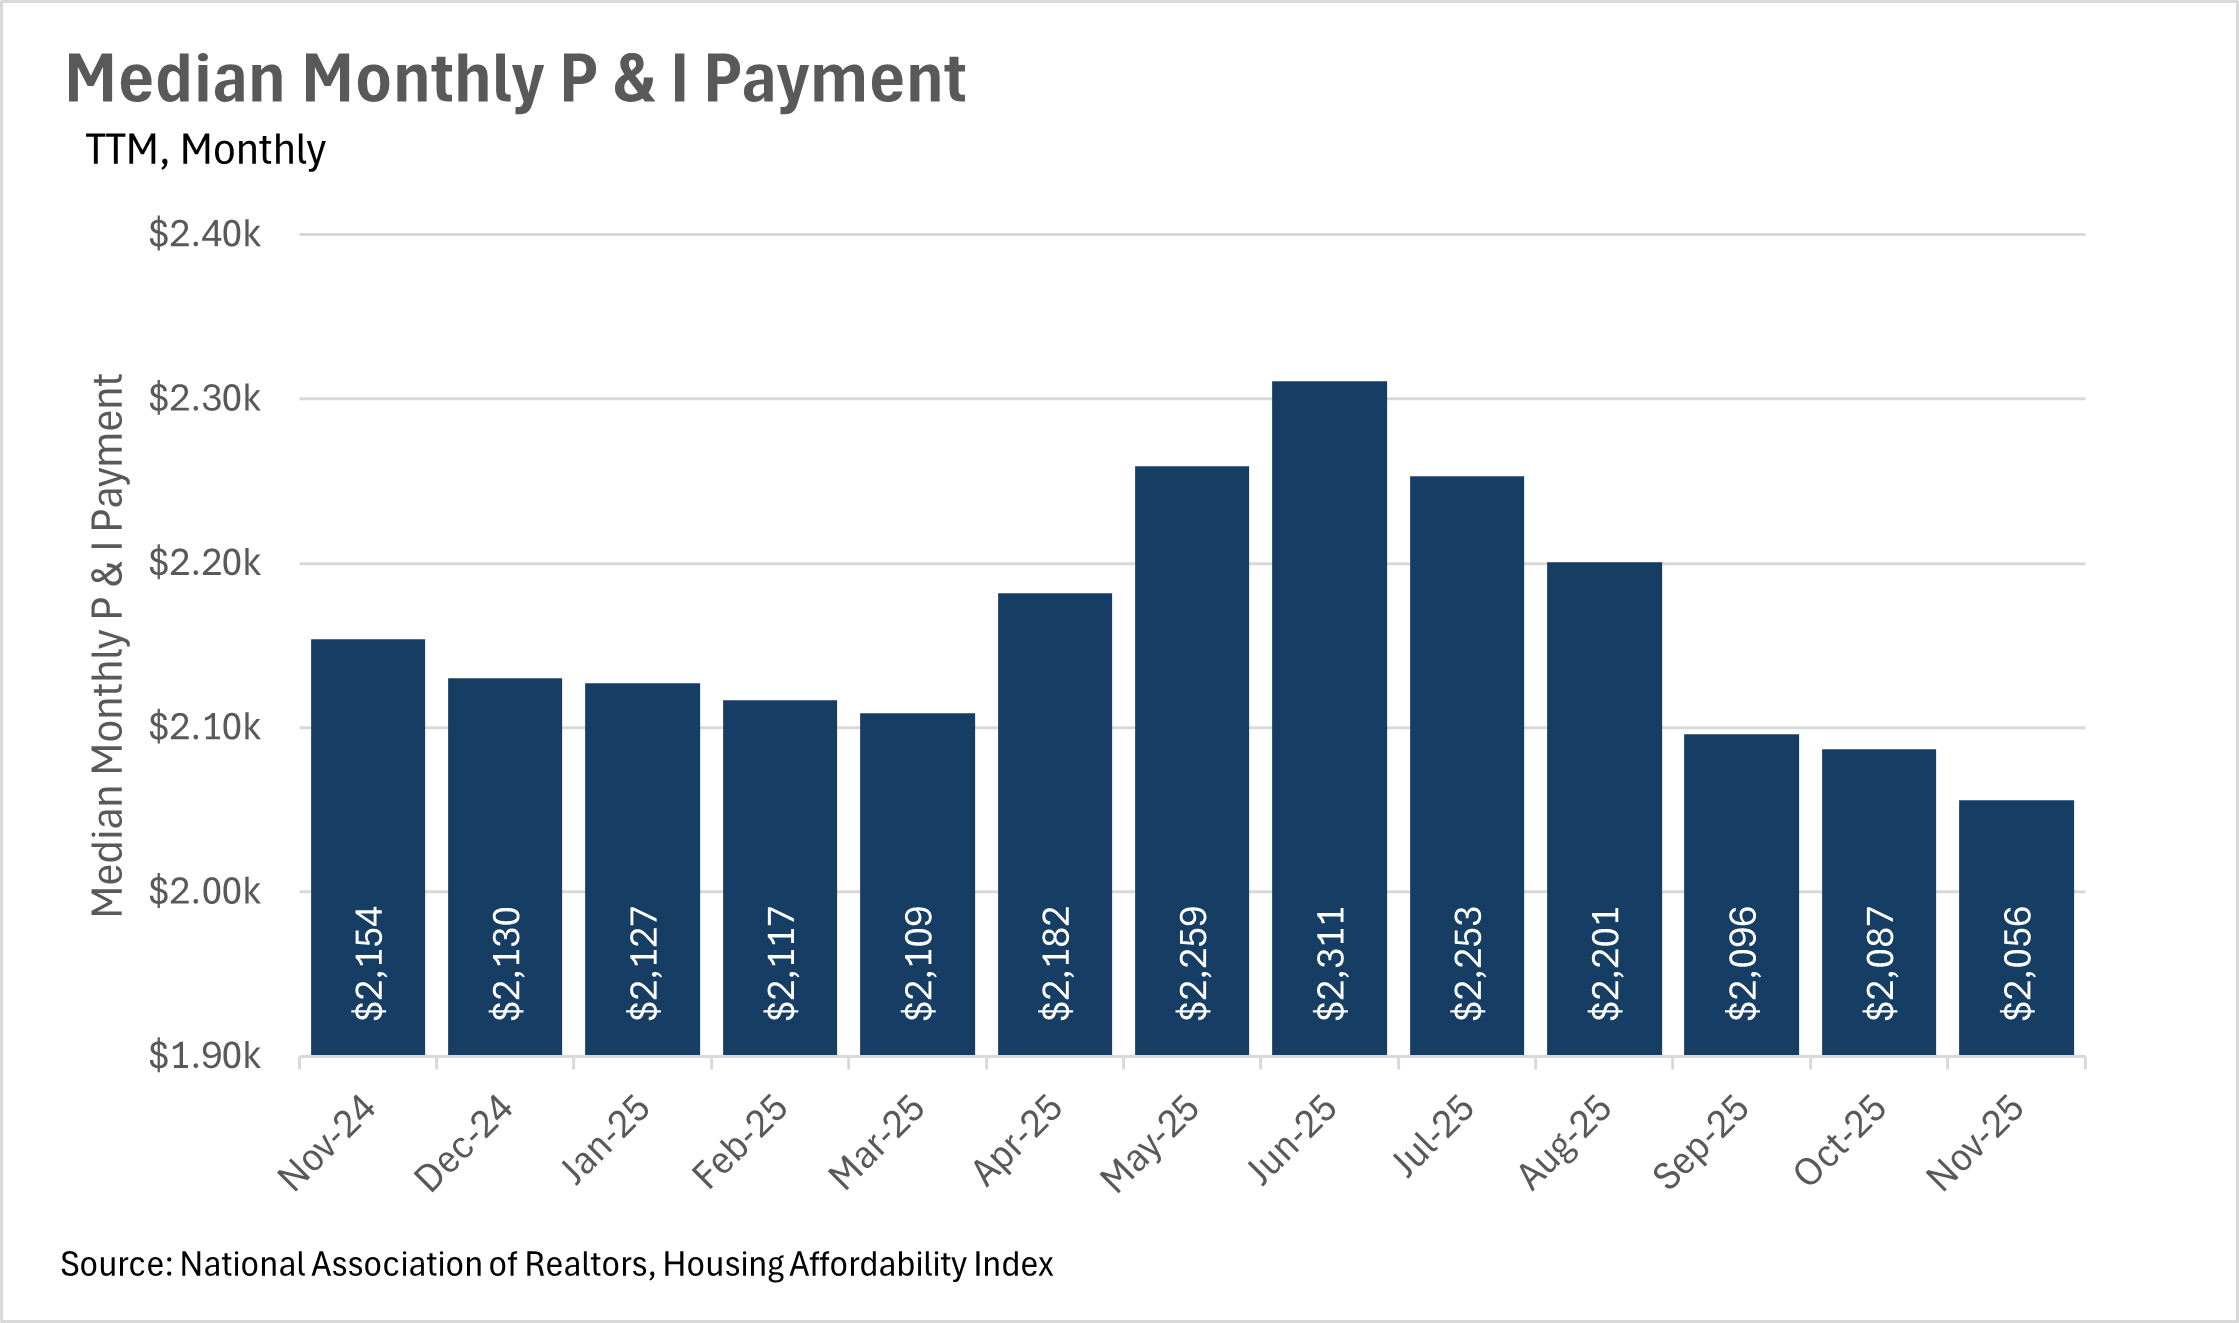
As interest rates continue to fall, median monthly P&I payments do as well, making housing slowly but surely more affordable on a national scale.
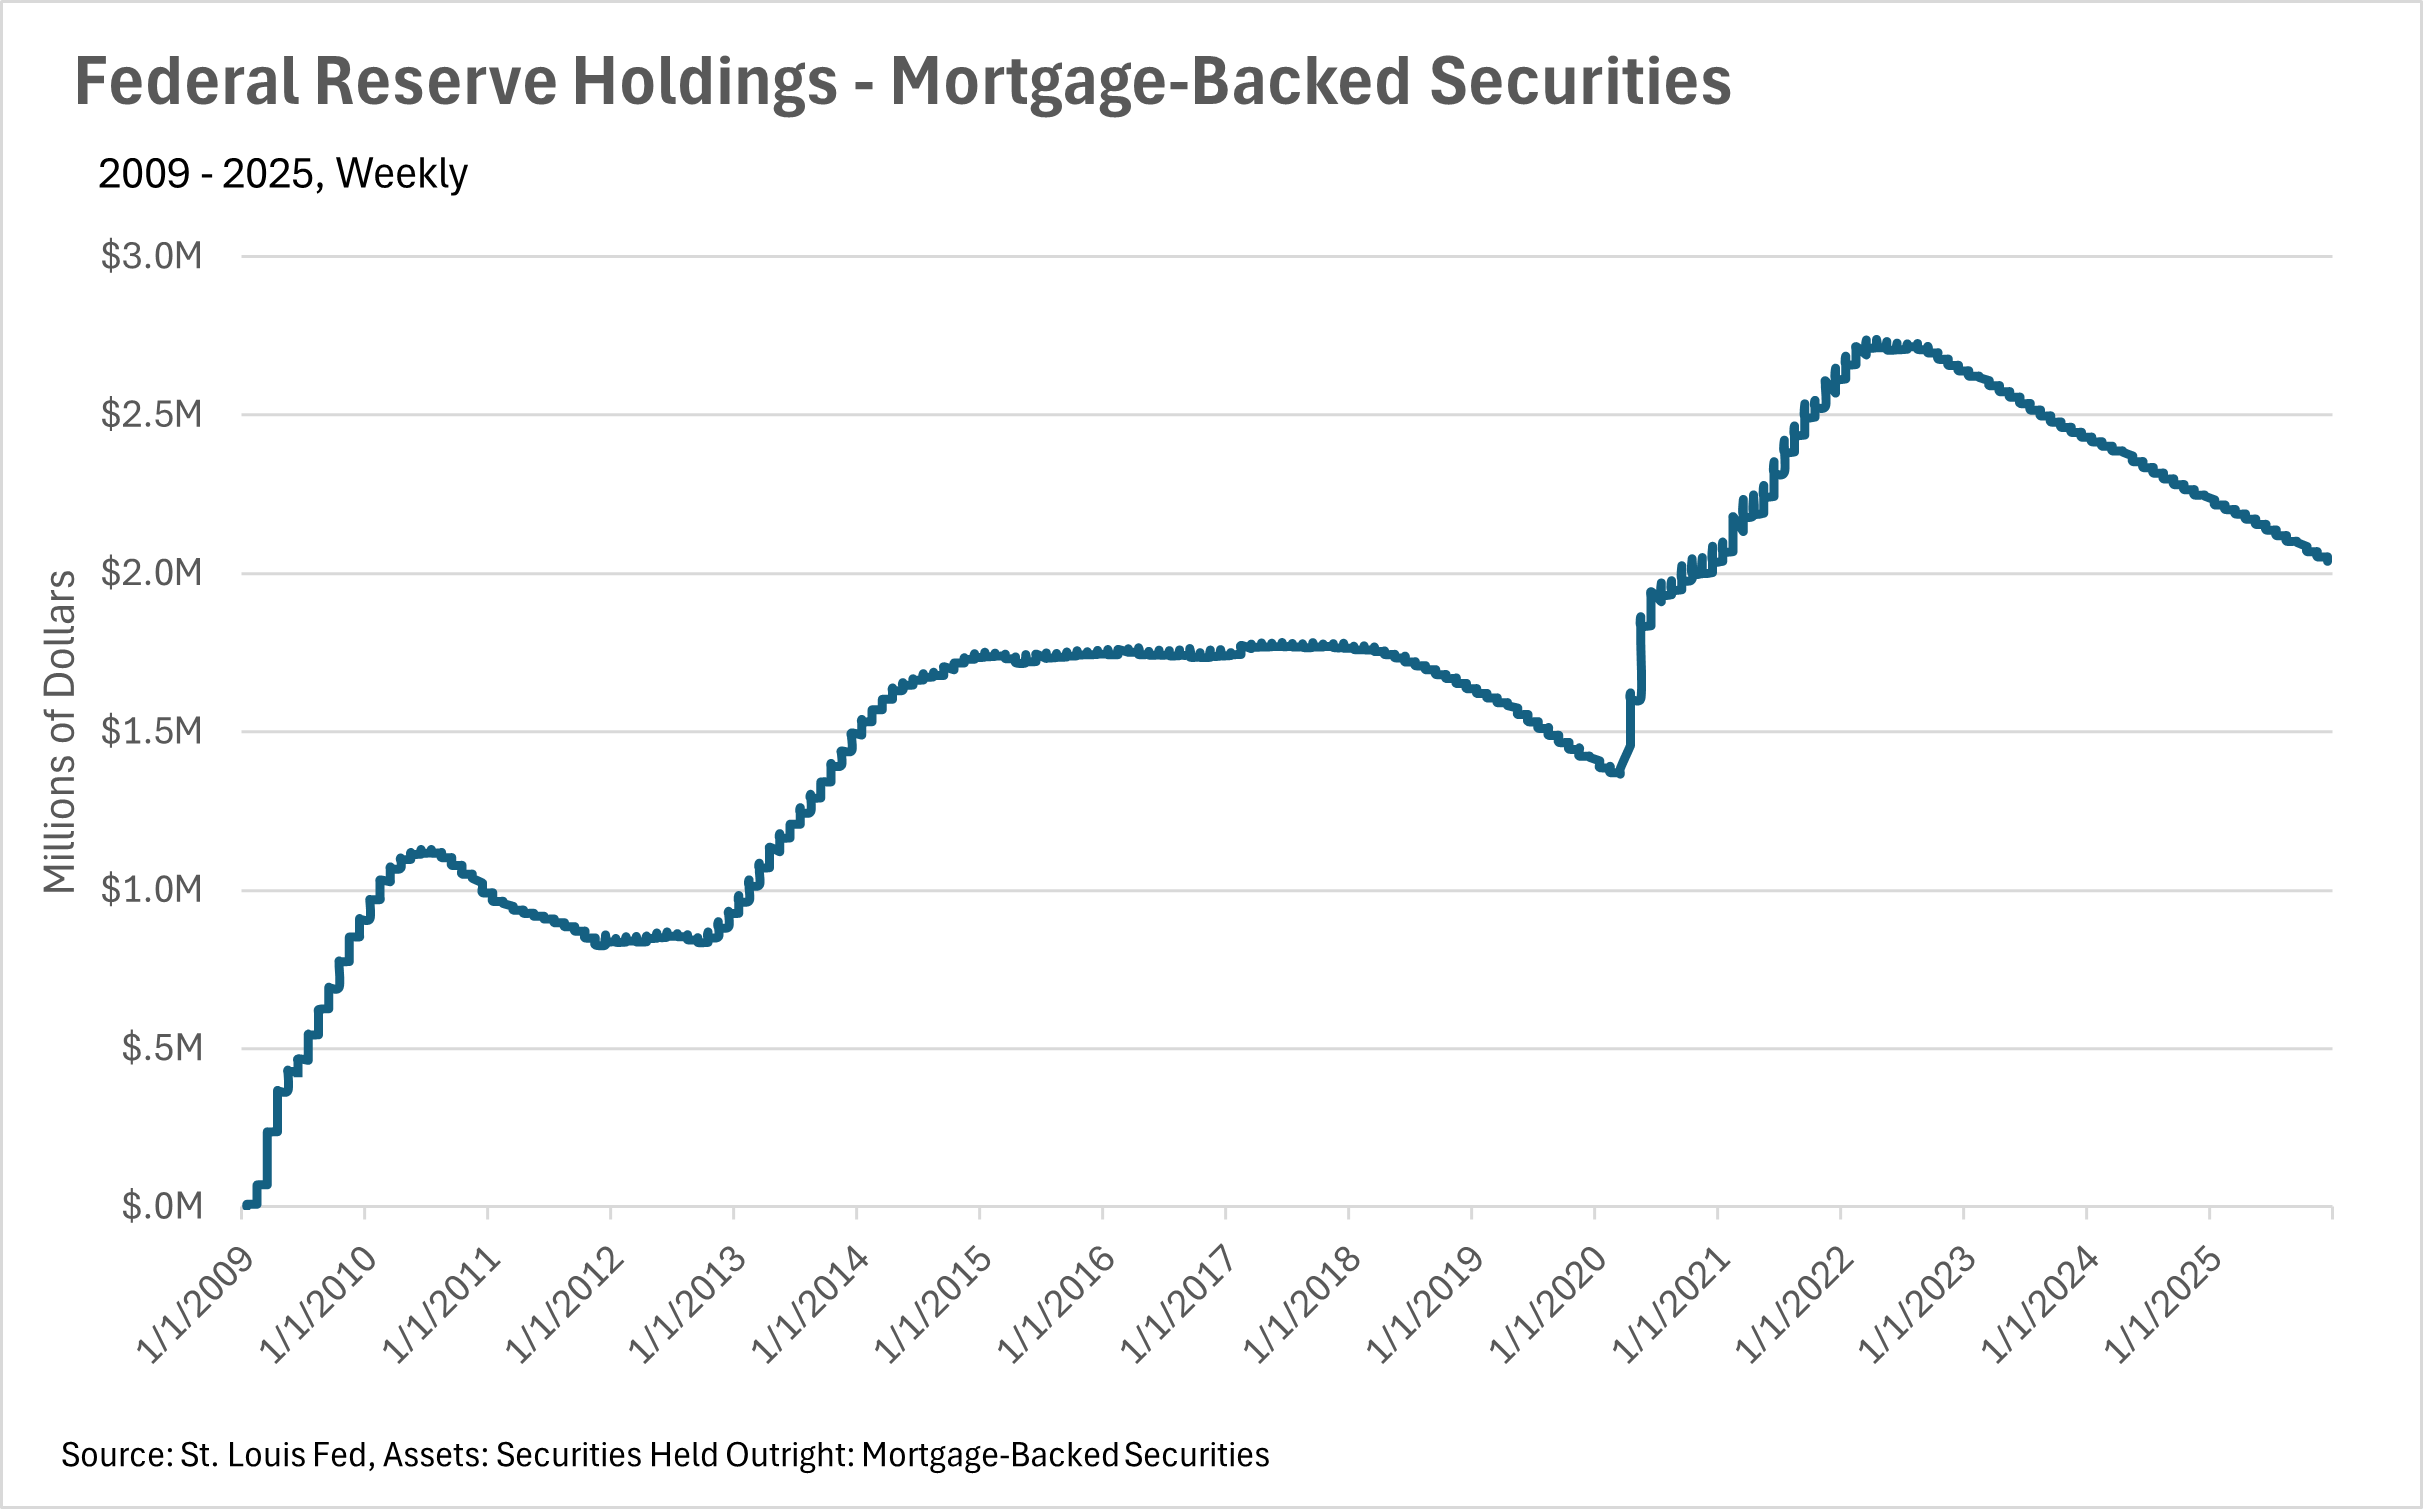
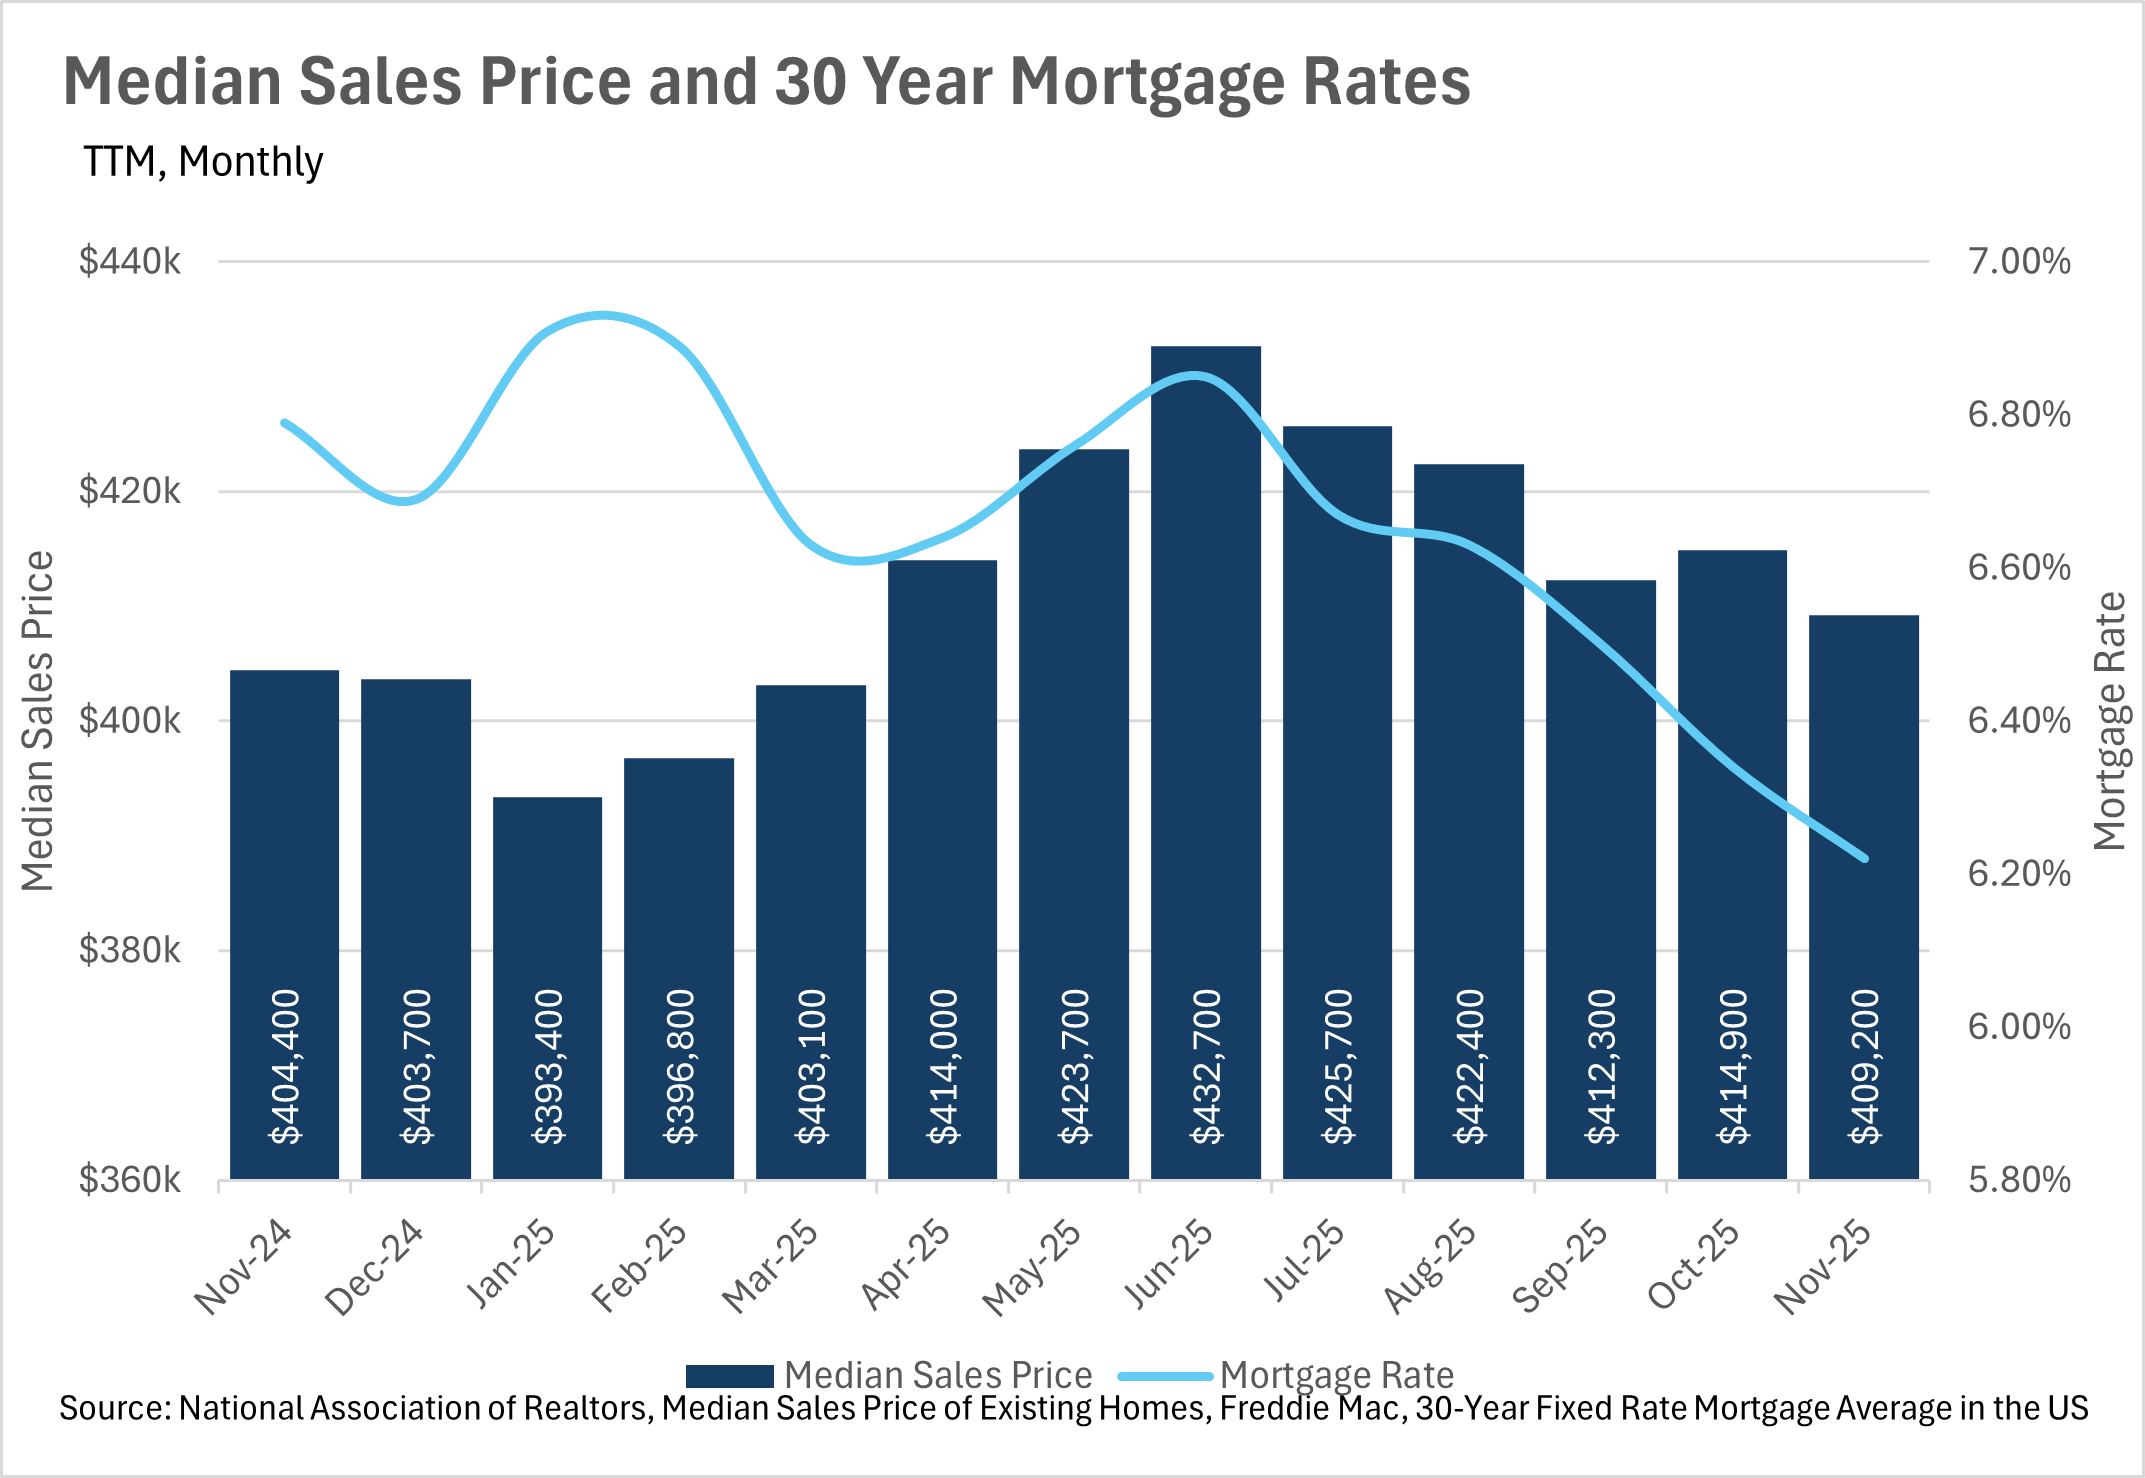
Mortgage rates are currently at the lowest point they’ve been at in recent years, as the Fed continues its rate cut cycle.
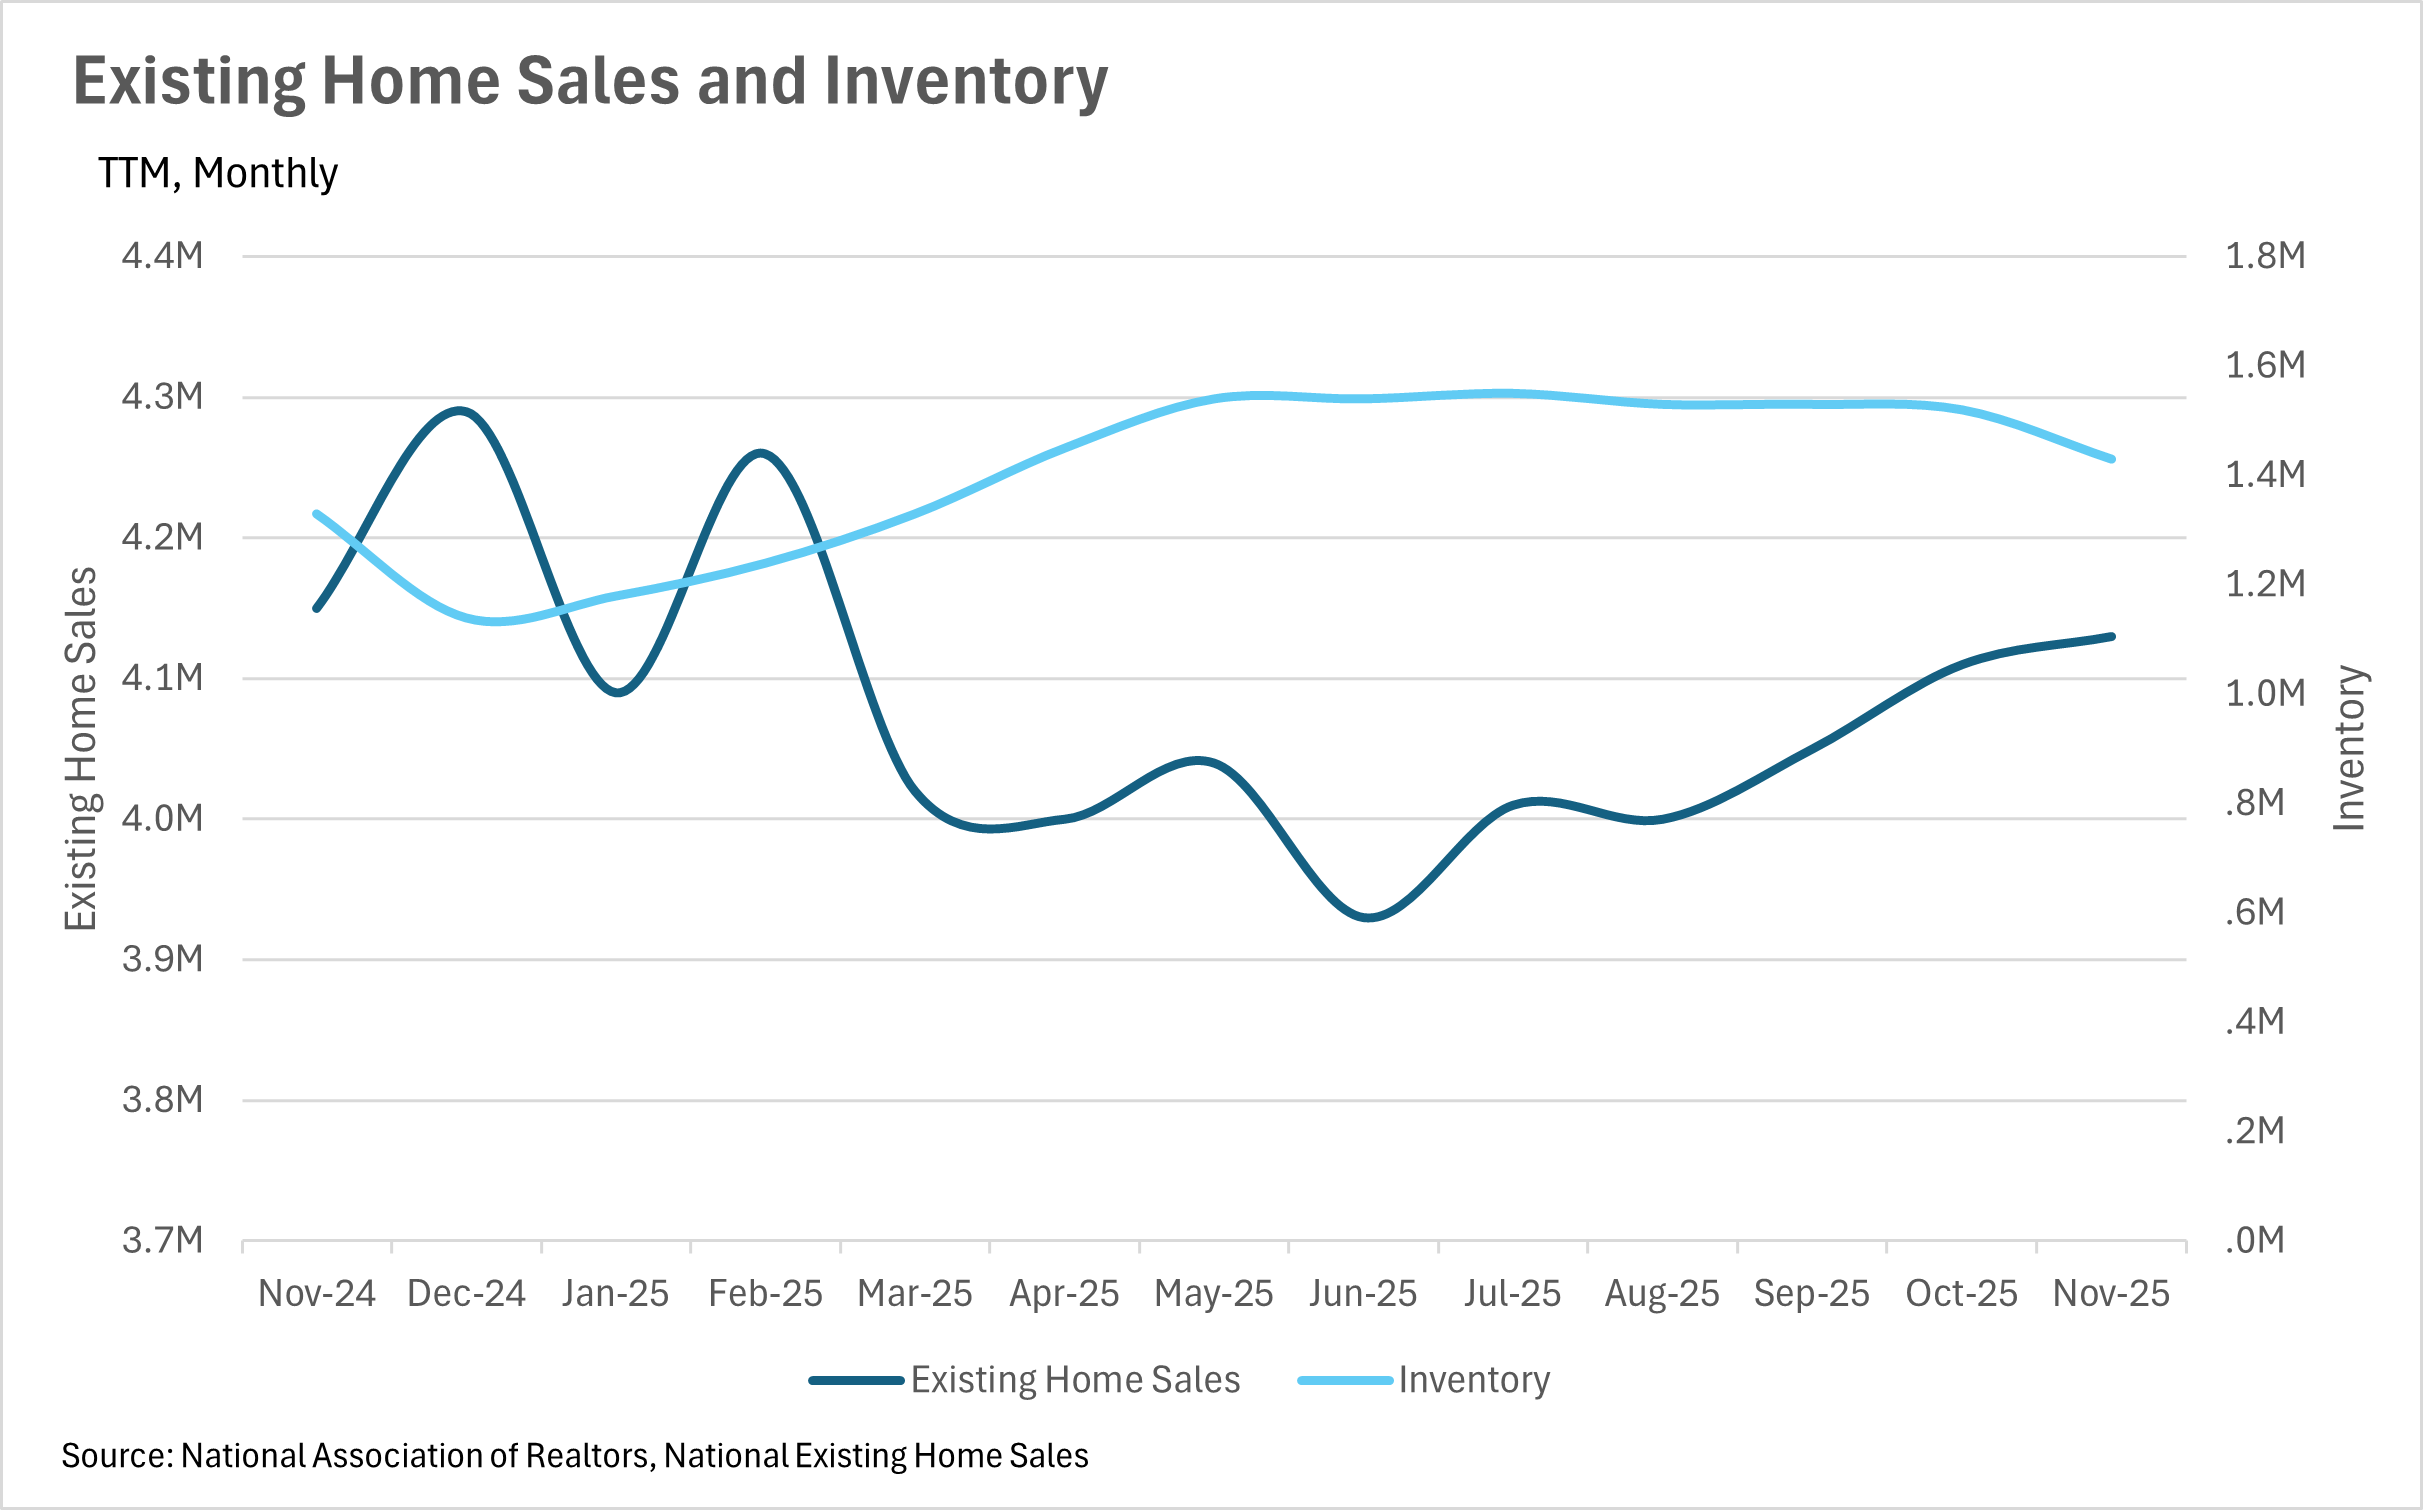
Despite falling interest rates, inventories still remain higher than they were at this point last year.
We very briefly saw rates break the 6% mark recently, following some commentary from Trump regarding the purchase of mortgage-backed securities by Fannie and Freddie.
Note: You can find the charts & graphs for the Big Story at the end of the following section.
*National Association of REALTORS® data is released two months behind, so we estimate the most recent month's data when possible and appropriate.
Homeownership is slowly but surely becoming more attainable
With the median monthly P&I payment hitting $2,056 in November, that marks a considerable decrease from the $2,311 maximum that we hit earlier in the year. As you might have guessed, this is largely due to interest rates declining, as the Federal Reserve continues its rate cutting cycle. In November of 2024, interest rates were at 6.79%, compared to 6.22% in November of 2025. This represents an 8.39% decrease in interest rates on a year-over-year basis, while the median sale price of a home in the US actually increased by 1.19% during that same period of time. As interest rates slowly creep down, we will likely see home values continue to increase, as the deciding factor for most people is not the total purchase amount, but instead the monthly payment that they can afford.
Mortgage rates fall to the lowest levels we’ve seen in years
As we mentioned in the prior section, interest rates continue to creep lower and lower. We saw rates hit 6.22% in November, and have fallen even further since then. As of right now, the average interest rate for a 30 year, fixed rate mortgage is sitting around 6.06%, which is actually a slight increase from what we briefly saw last week. Unfortunately, some recent commentary from the Fed has led markets to believe we won’t see a rate cut as a result of the January FOMC meeting, as CME FedWatch puts the probability of a 25 bps cut at just 5% for January. However, it’ll be important to pay attention to the economic data that’s being released over the coming months, as it’ll give us a good idea of where we can expect rates to go in the near term future.
Although mortgage rates are down, inventories are up!
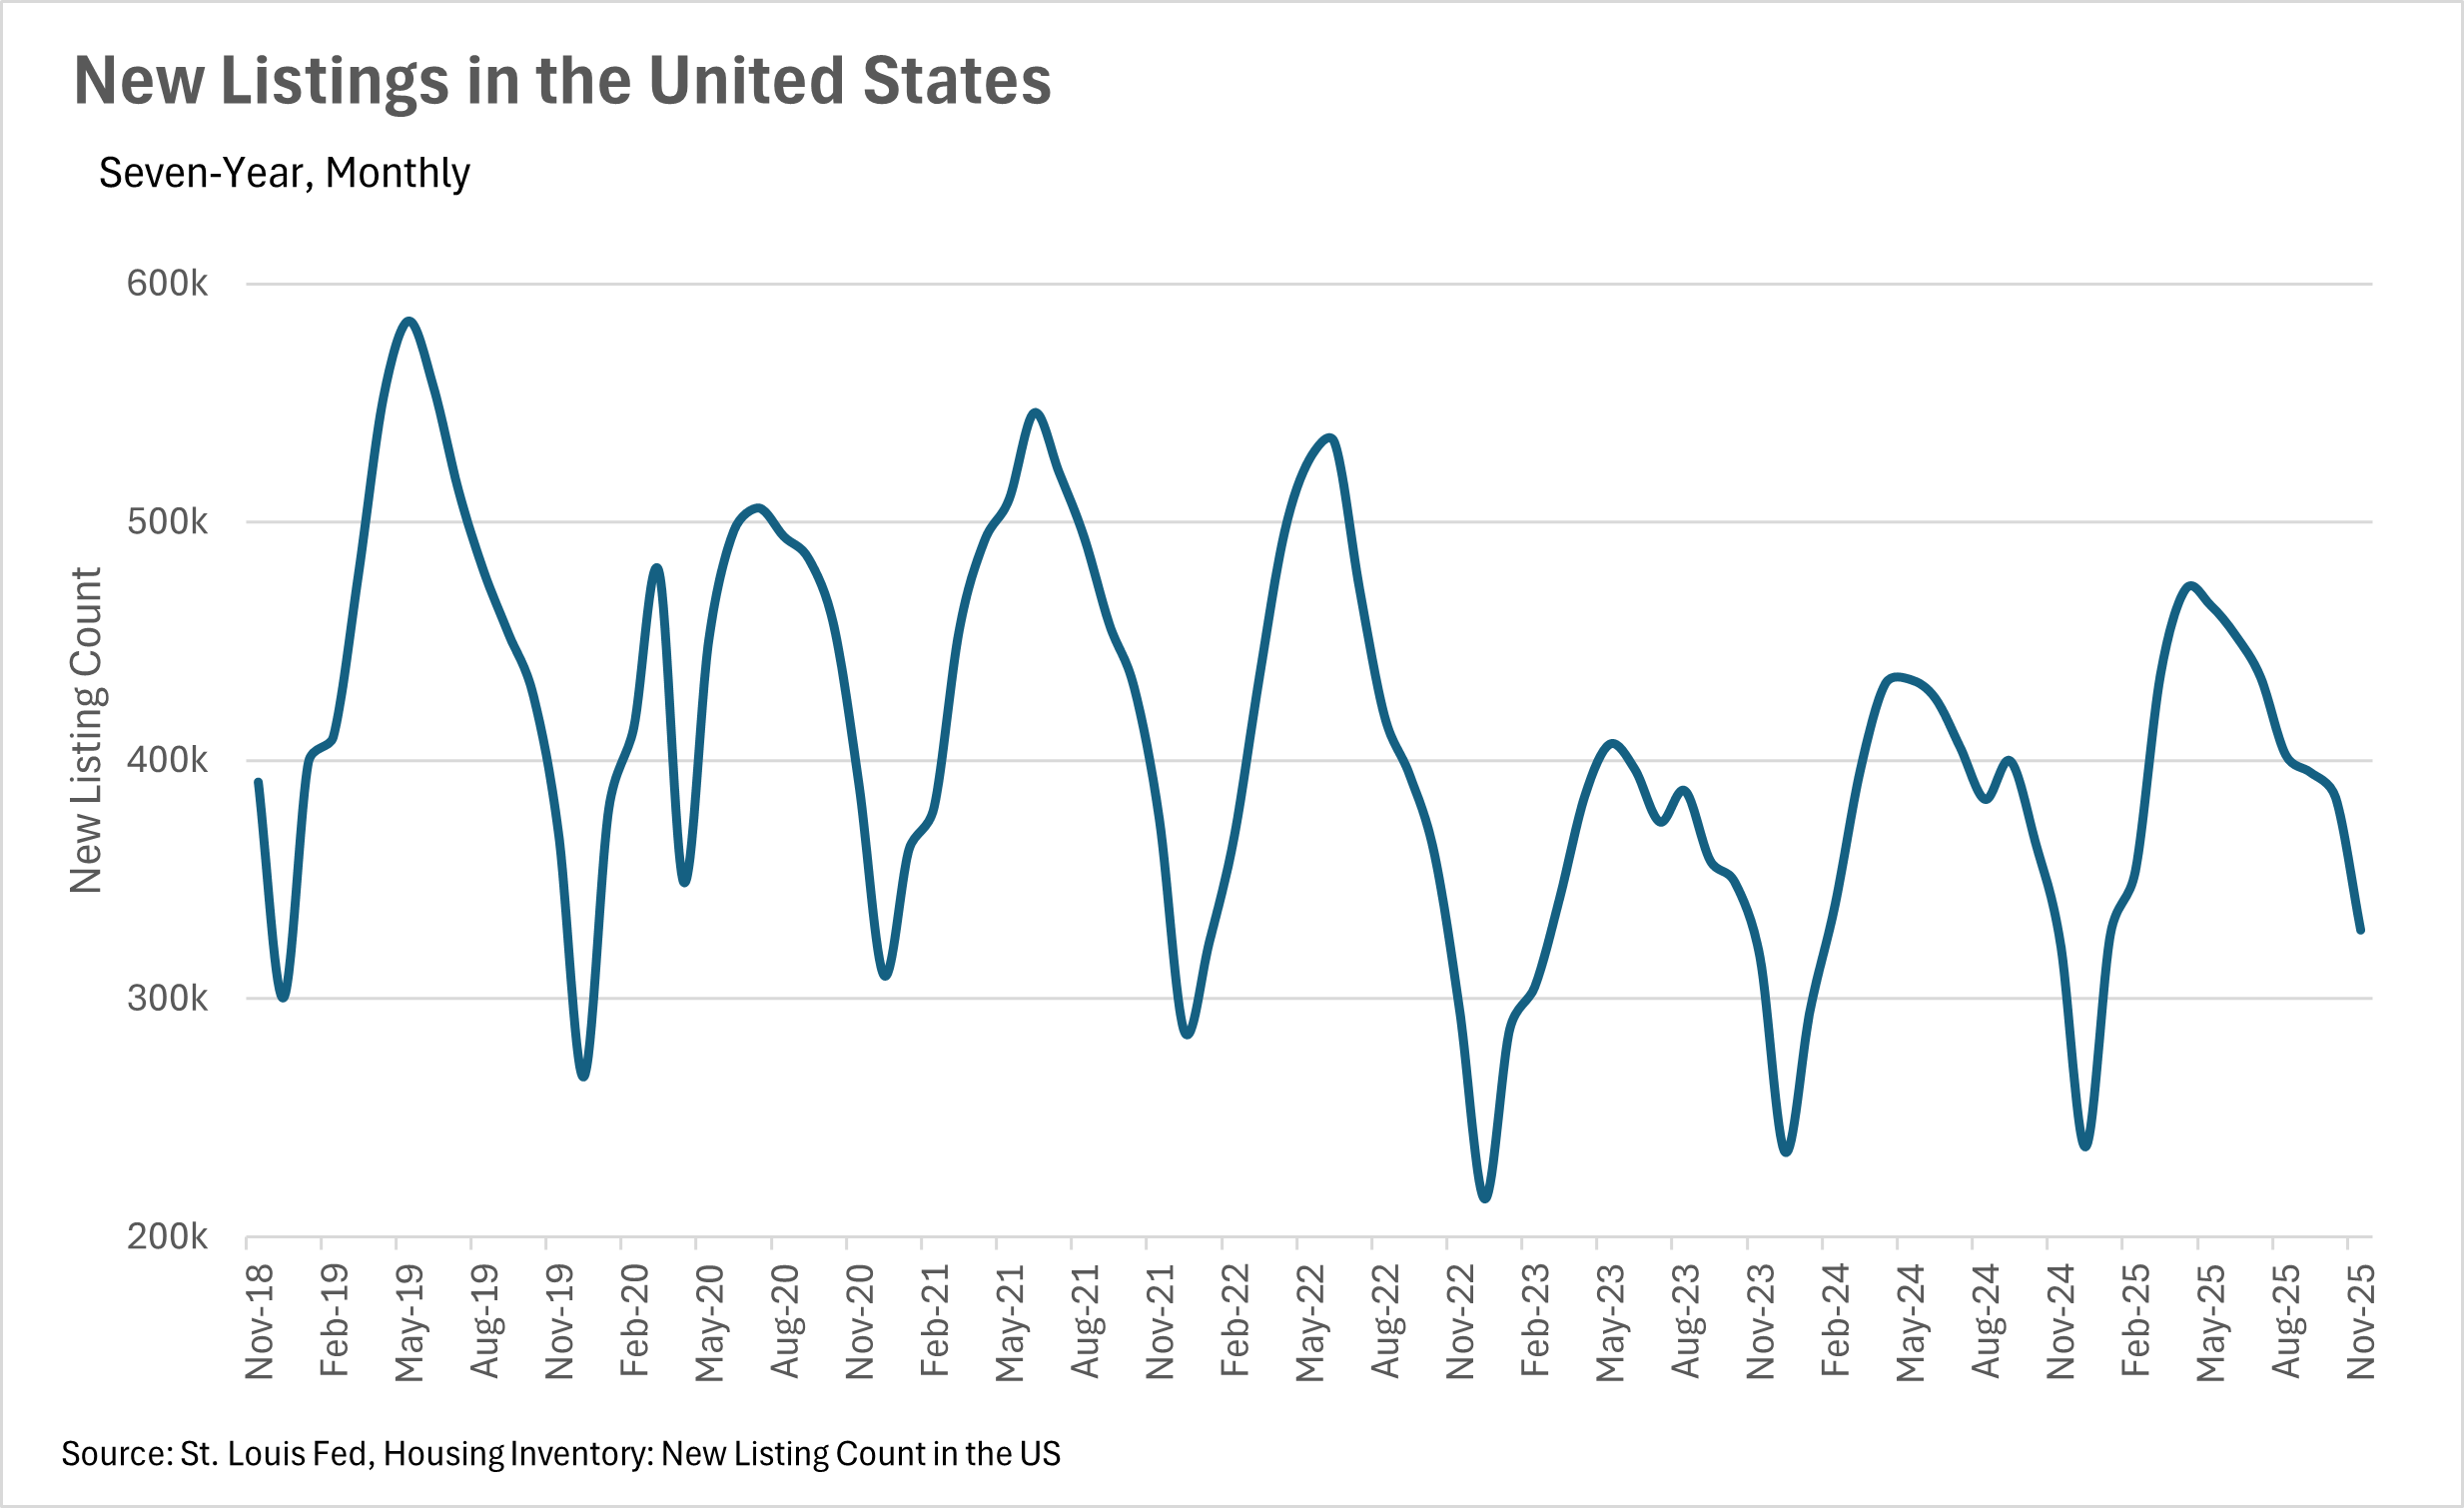
While you might expect inventories to decrease as interest rates decrease, that wasn’t the case in November. In fact, we saw inventories increase by 7.52% on a year-over-year basis, despite falling rates. This is largely attributable to the fact that existing home sales decreased by roughly half a percent while new home listings increased by roughly 1.7% on a year-over-year basis. We’ll likely see inventories continue to increase as we move through the winter months, until the usual spring rush begins and inventories start to move once again. Overally, we had a very different year in terms of market dynamics in 2025, so it’ll be interesting to watch where the market goes in 2026.
Keep an eye on the market as we move through 2026
We’ve gotten to the point where rates have been so high for so long, that there is a considerable cohort of people that’s waiting on the sidelines, carefully watching interest rates. This cohort of people is ready to make a move on their first home, or is looking for a good point in time to sell their existing home and move. Lately we’ve seen quite a bit of commentary out of the Federal Reserve that has markets thinking we’ll see rate cuts, especially when you couple this with the commentary regarding interest rates coming from the executive branch. If we do see some steeper rate cuts (more than the 25 bps cuts we’ve seen recently), then moving quickly will be pivotal for you and your clients, as bigger cuts will likely lead to the floodgates opening.
Of course, this is all what we’re seeing at a national, macro level. As we all know, real estate is a localized game, so be sure to check out your local lowdown below, to see what’s going on in your market!
Big Story Data
The Local Lowdown
Quick Take:
Single-family median sale prices rebounded across most of Silicon Valley in December, with San Mateo County posting nearly 10% year-over-year gains.
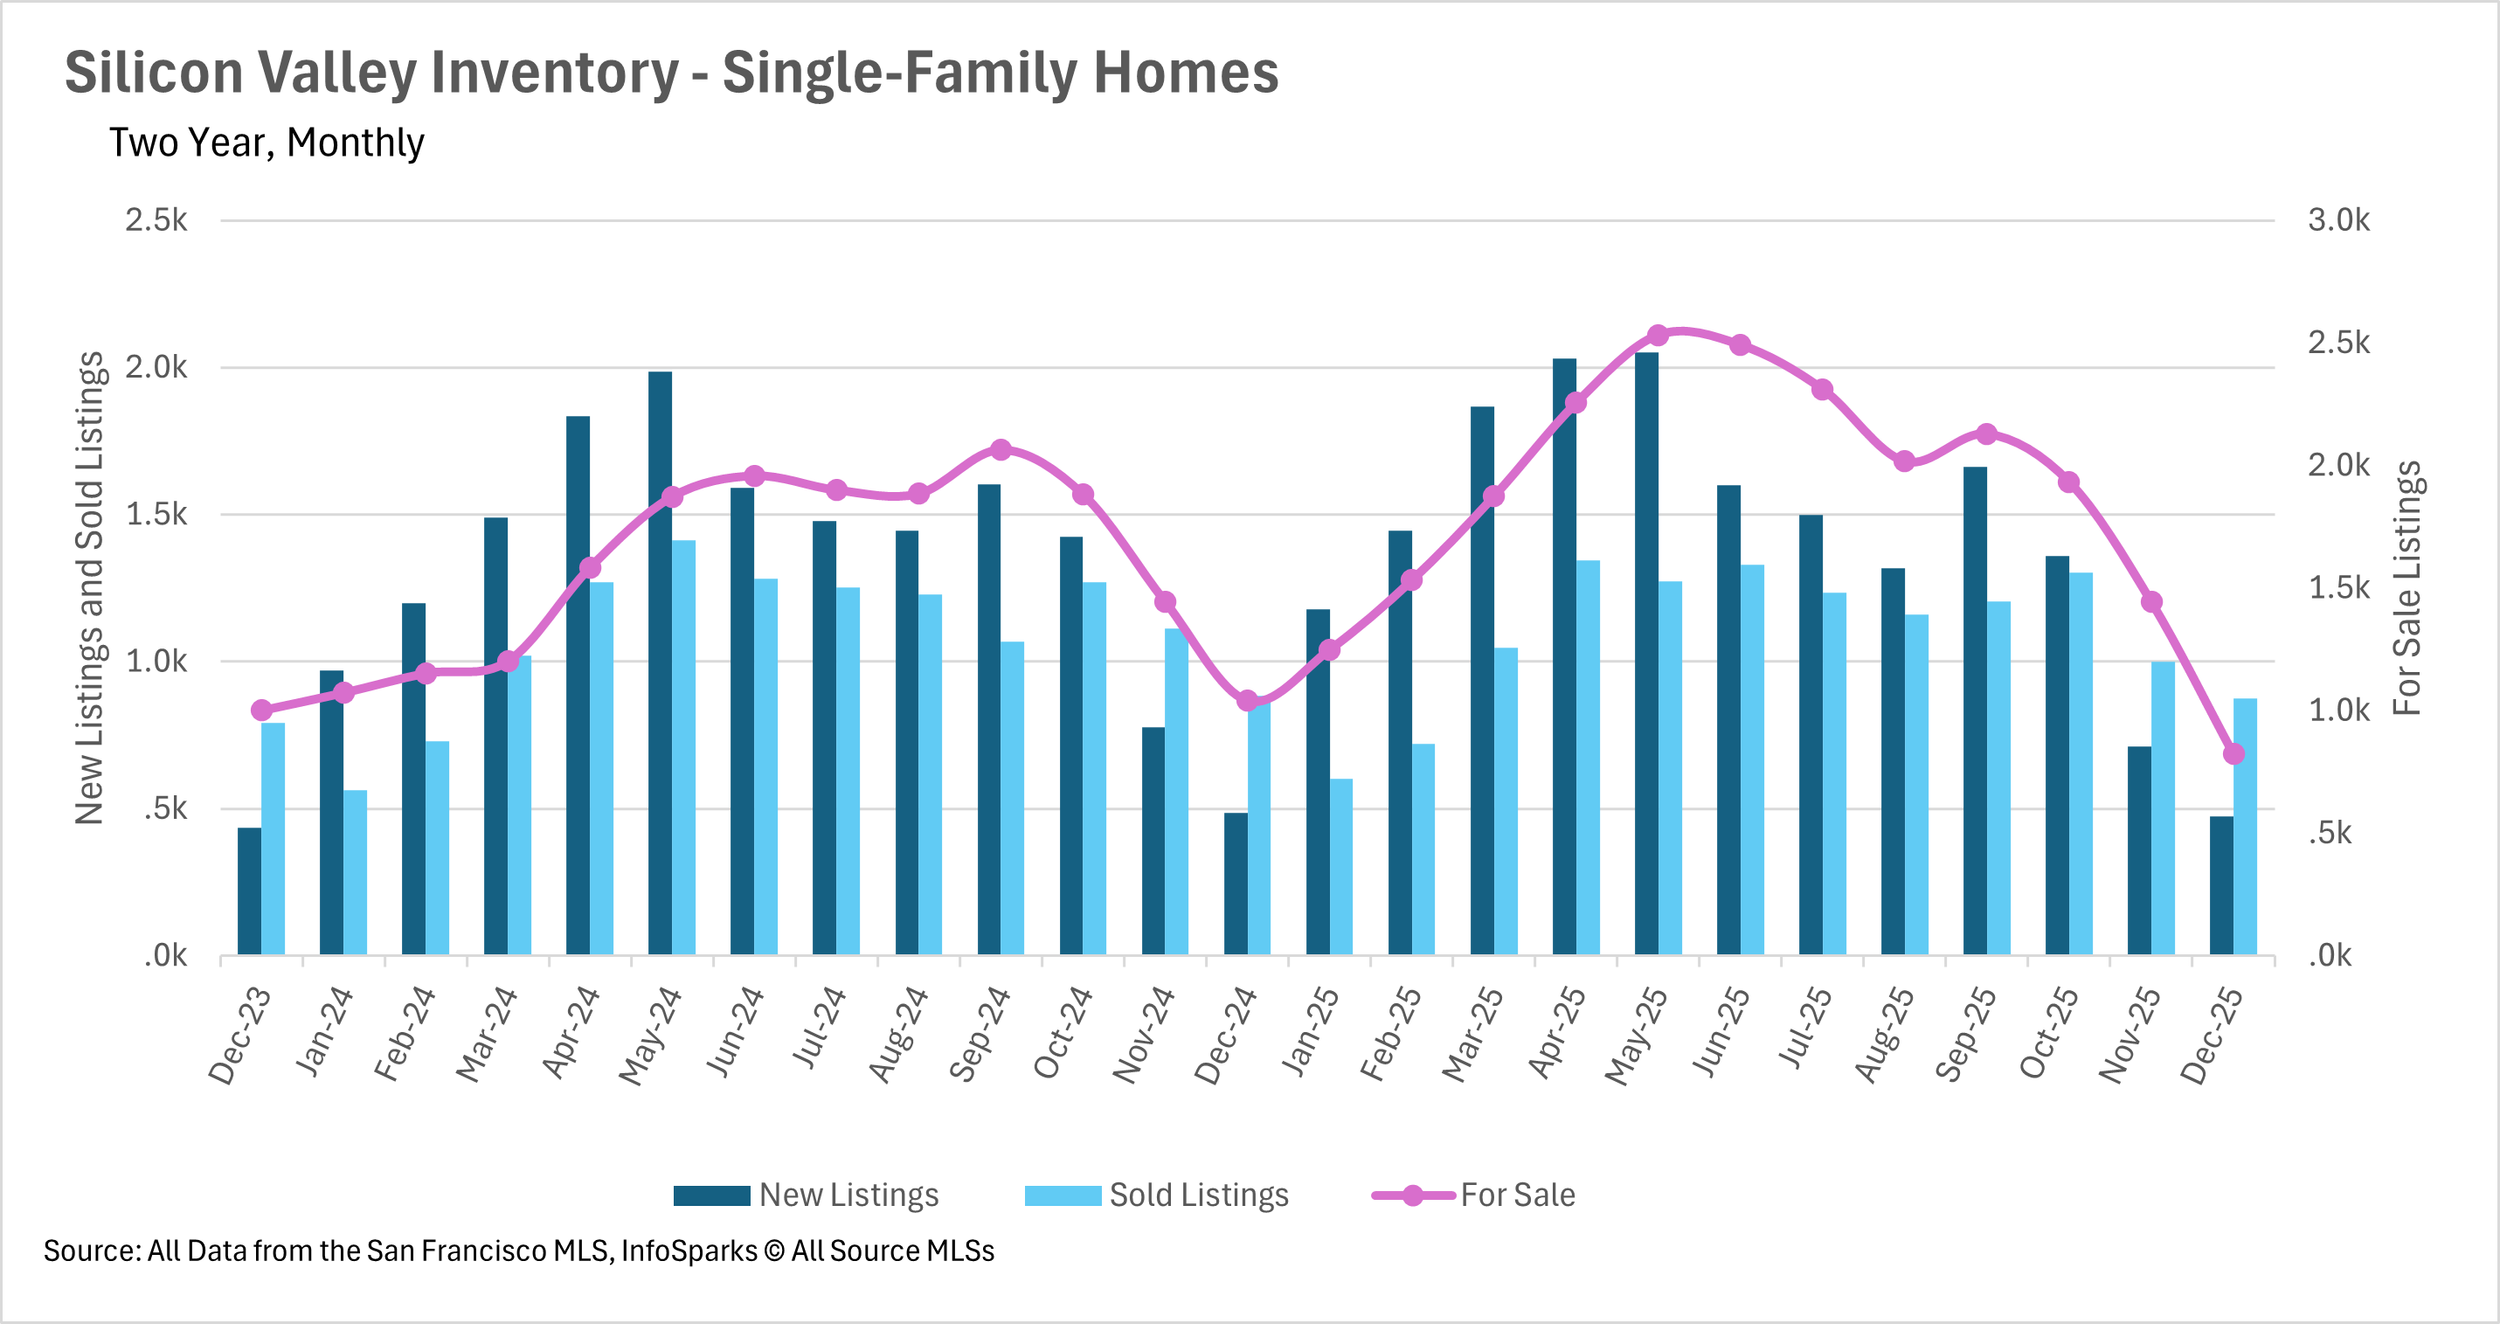
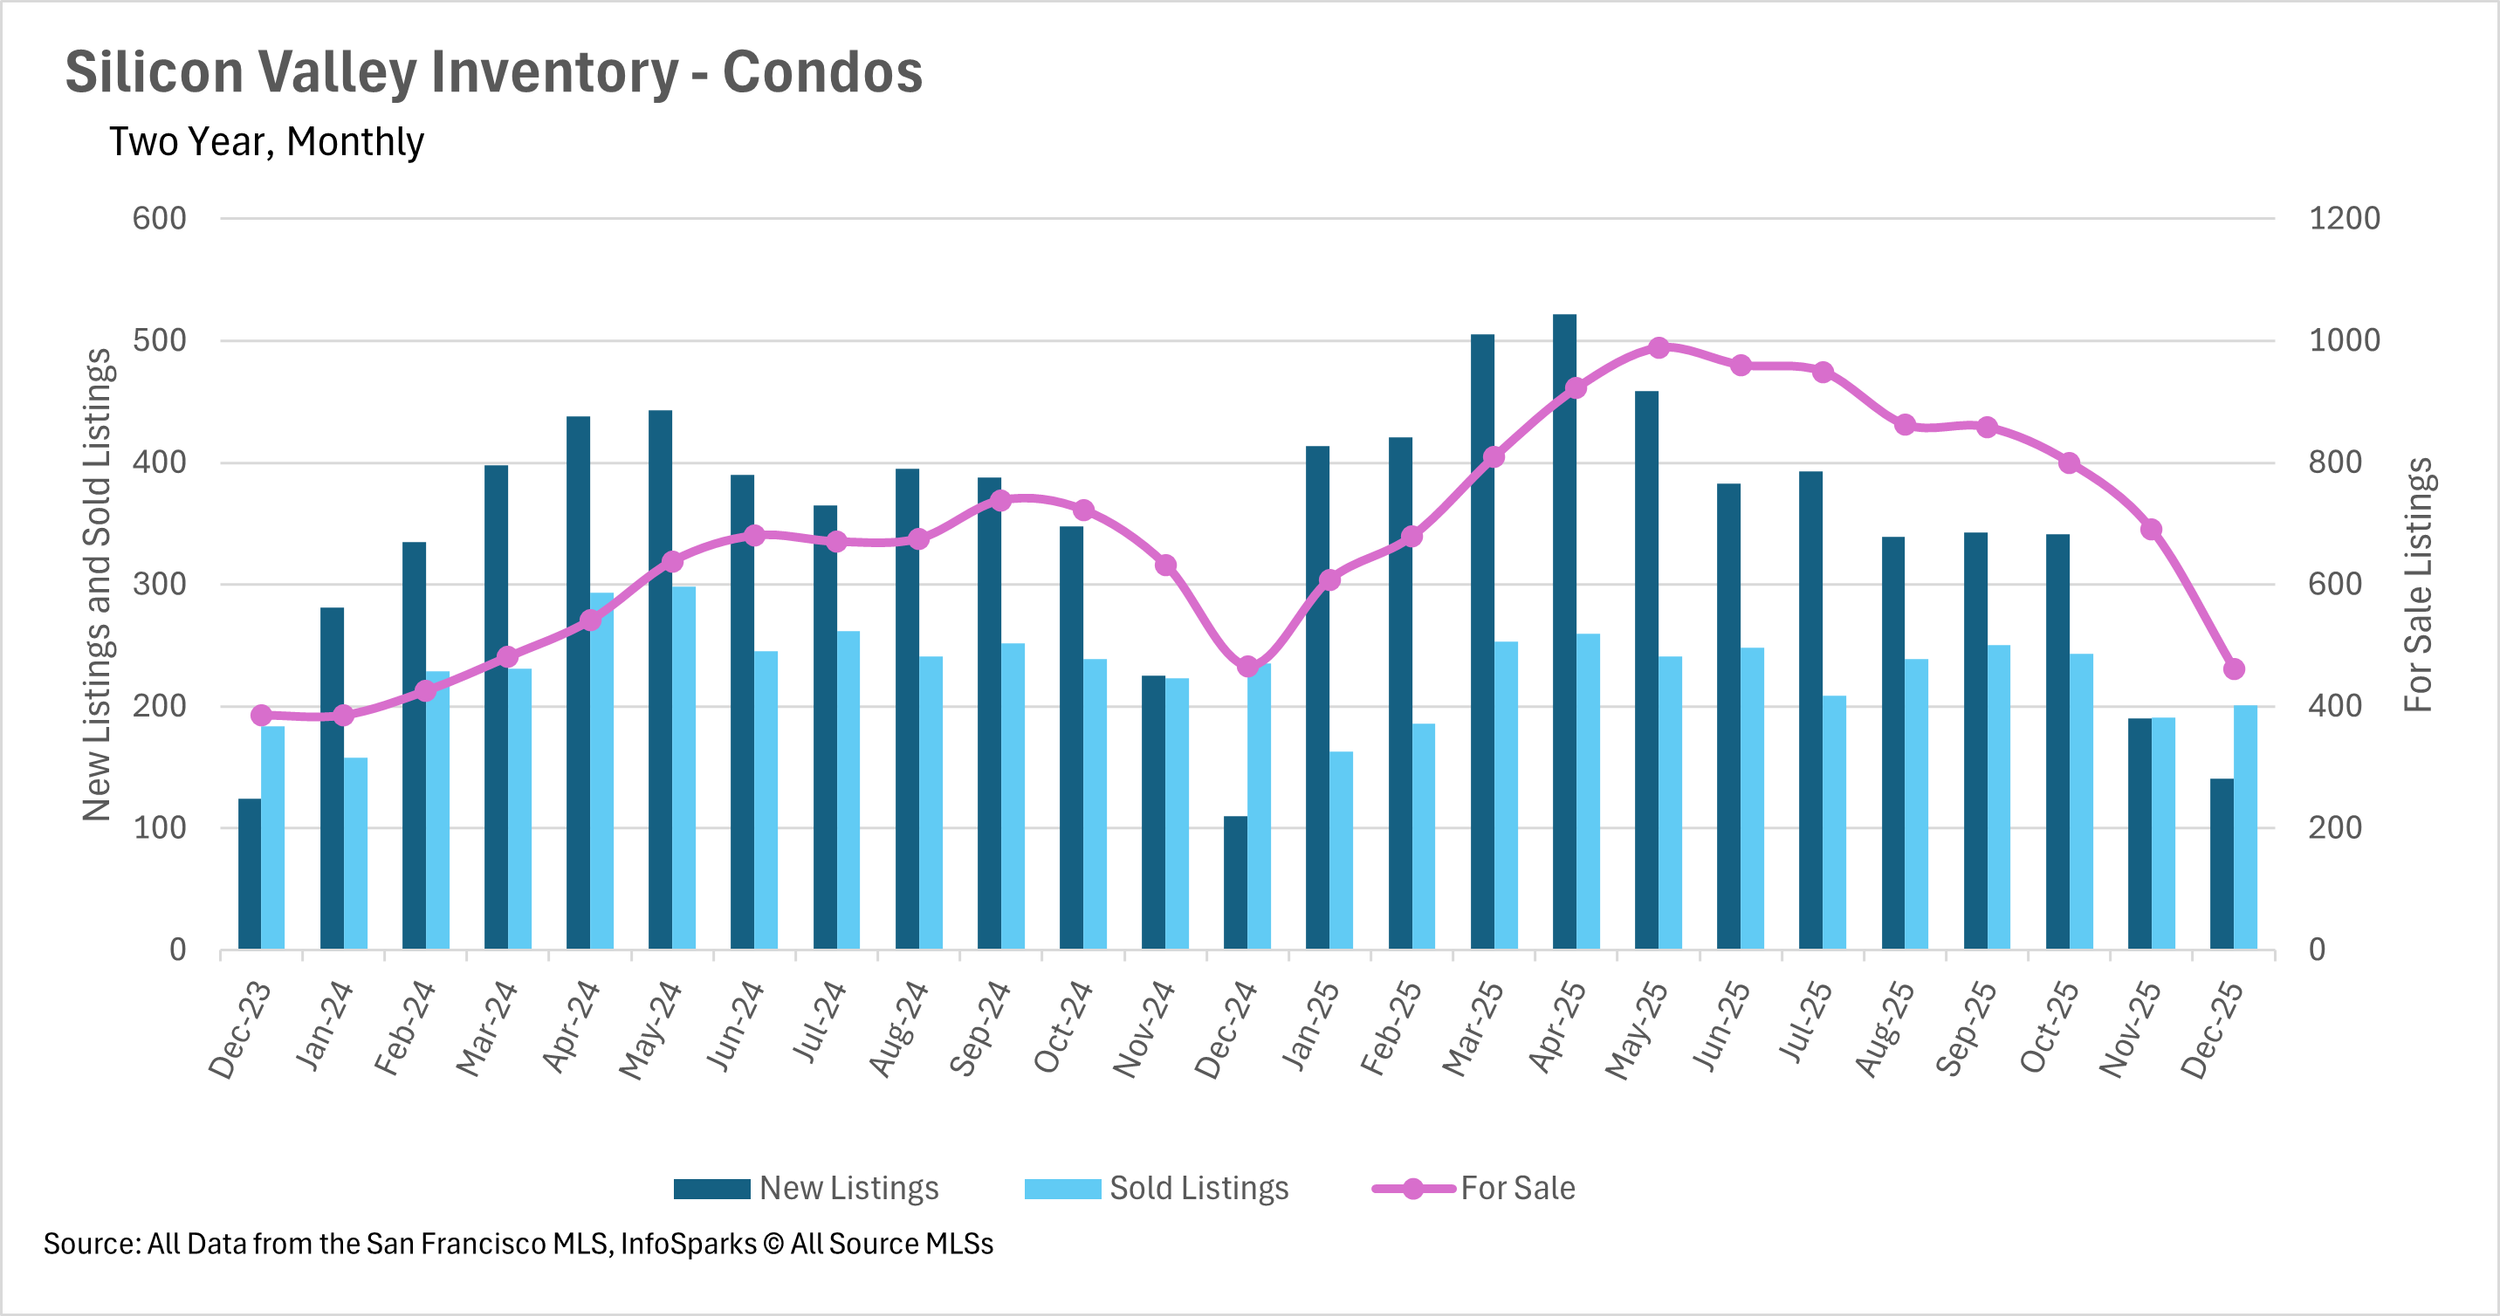
Inventory levels have plummeted to their lowest levels in years, with single-family home inventory down more than 21% year-over-year.
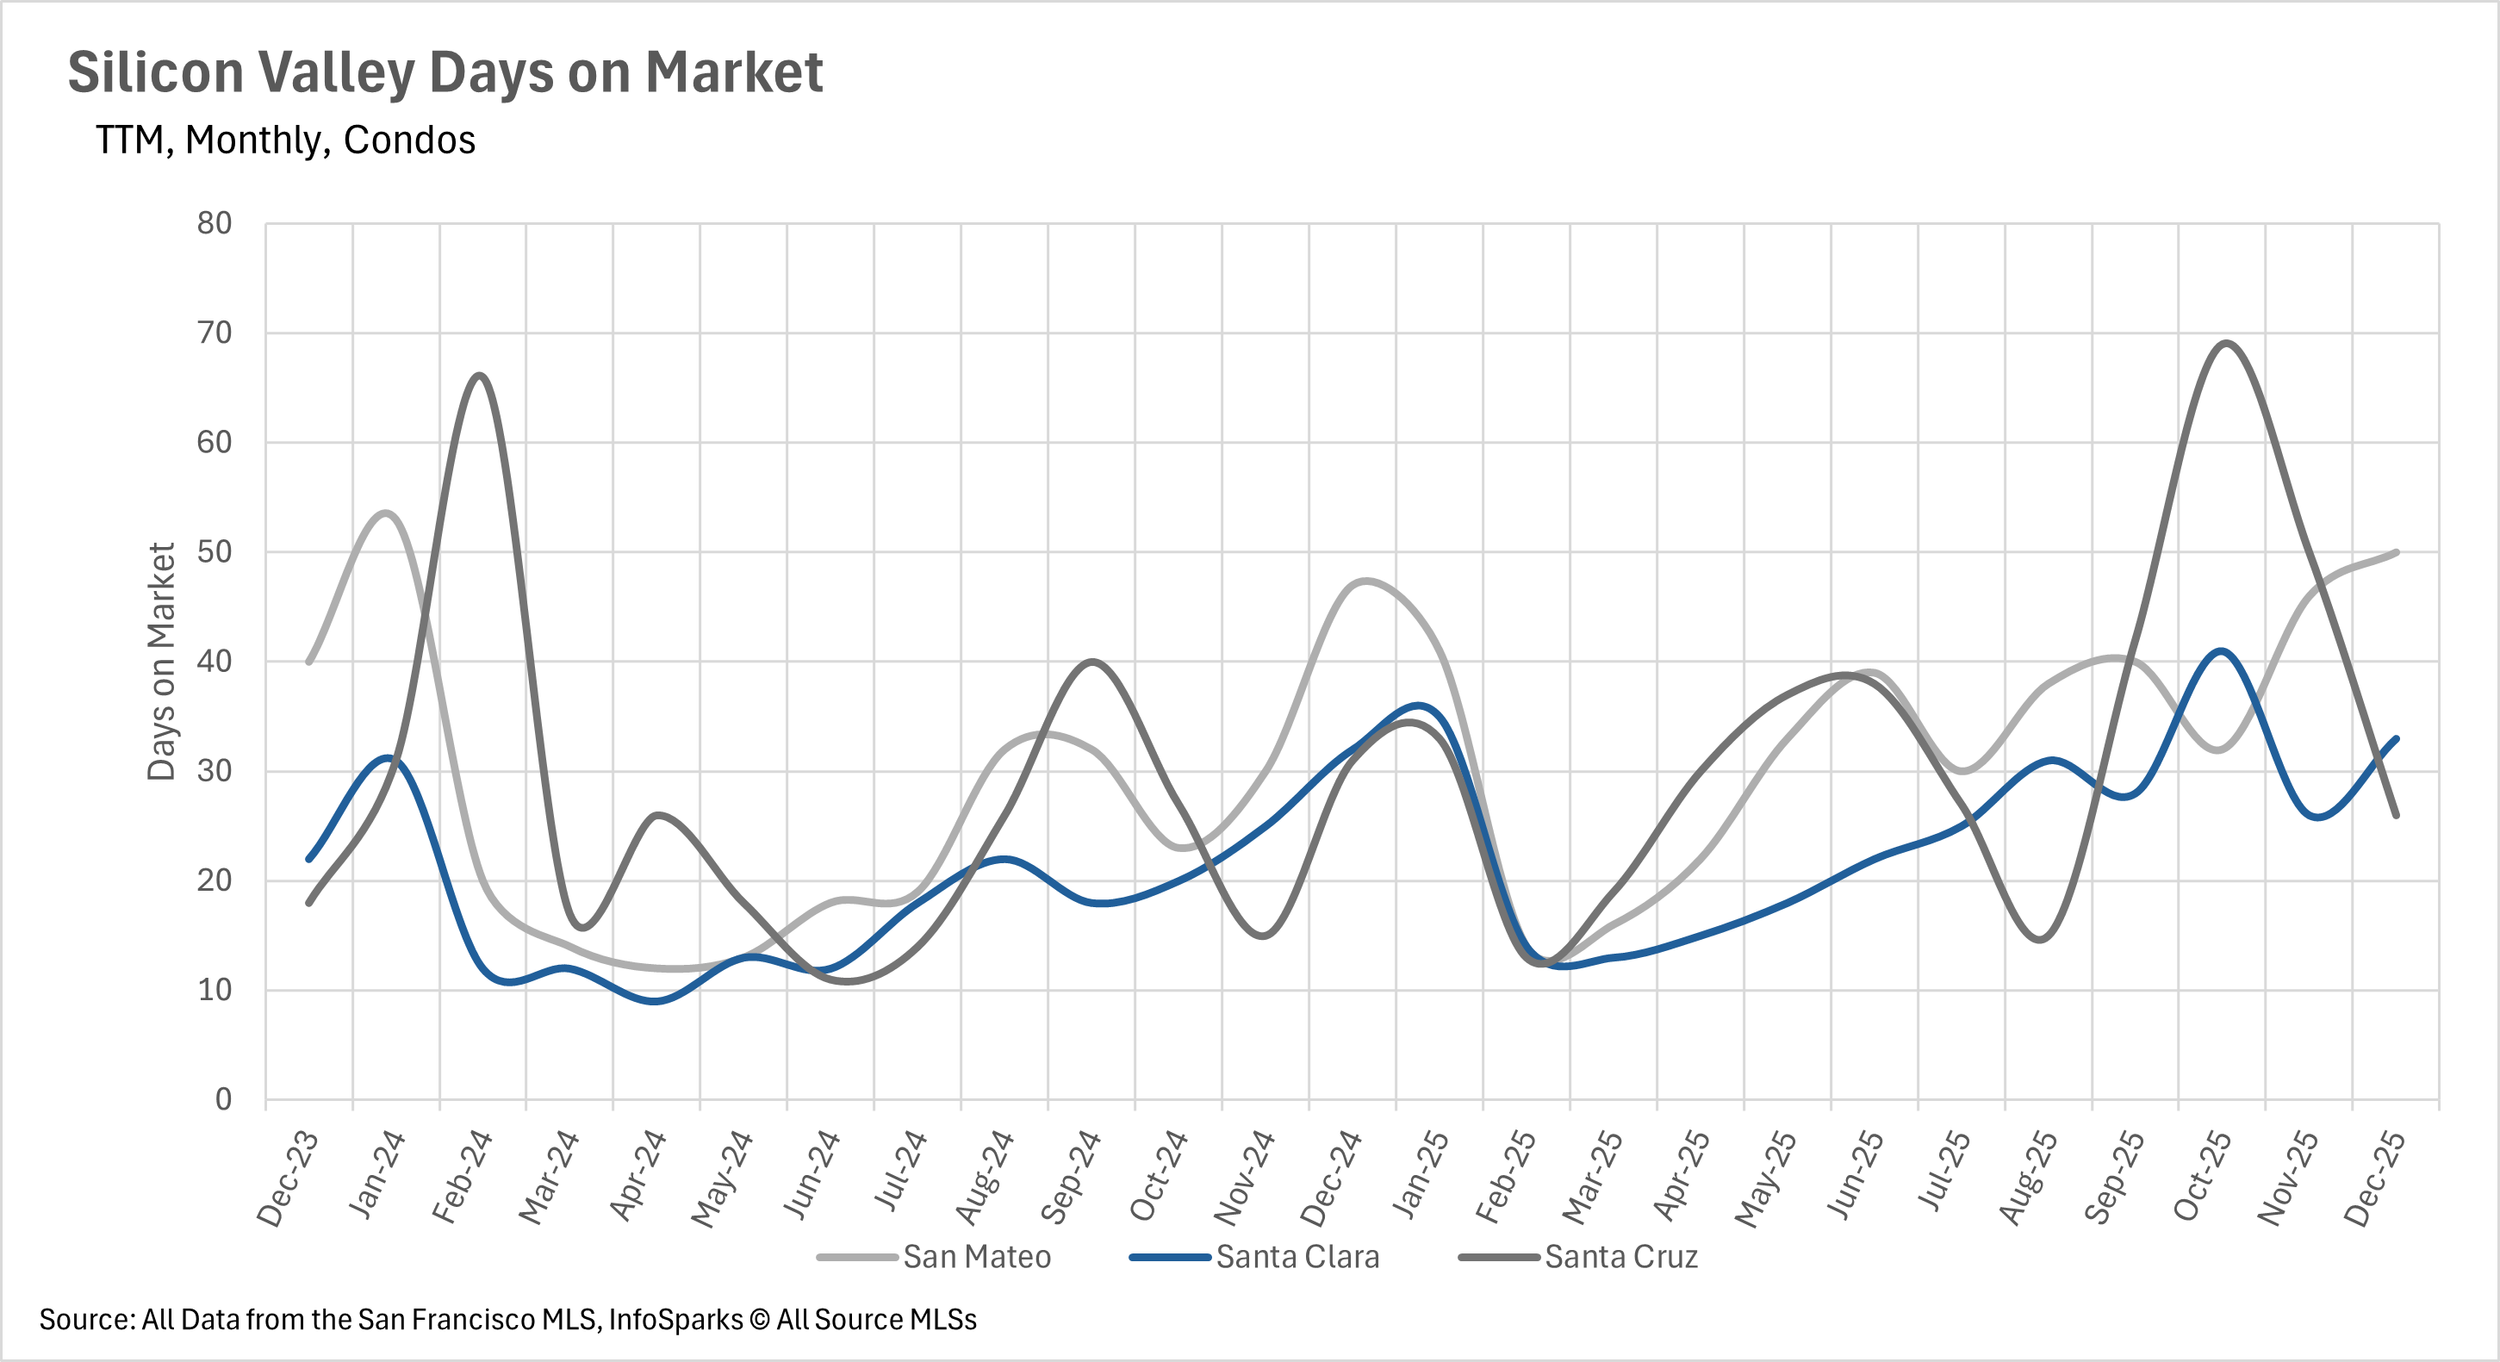
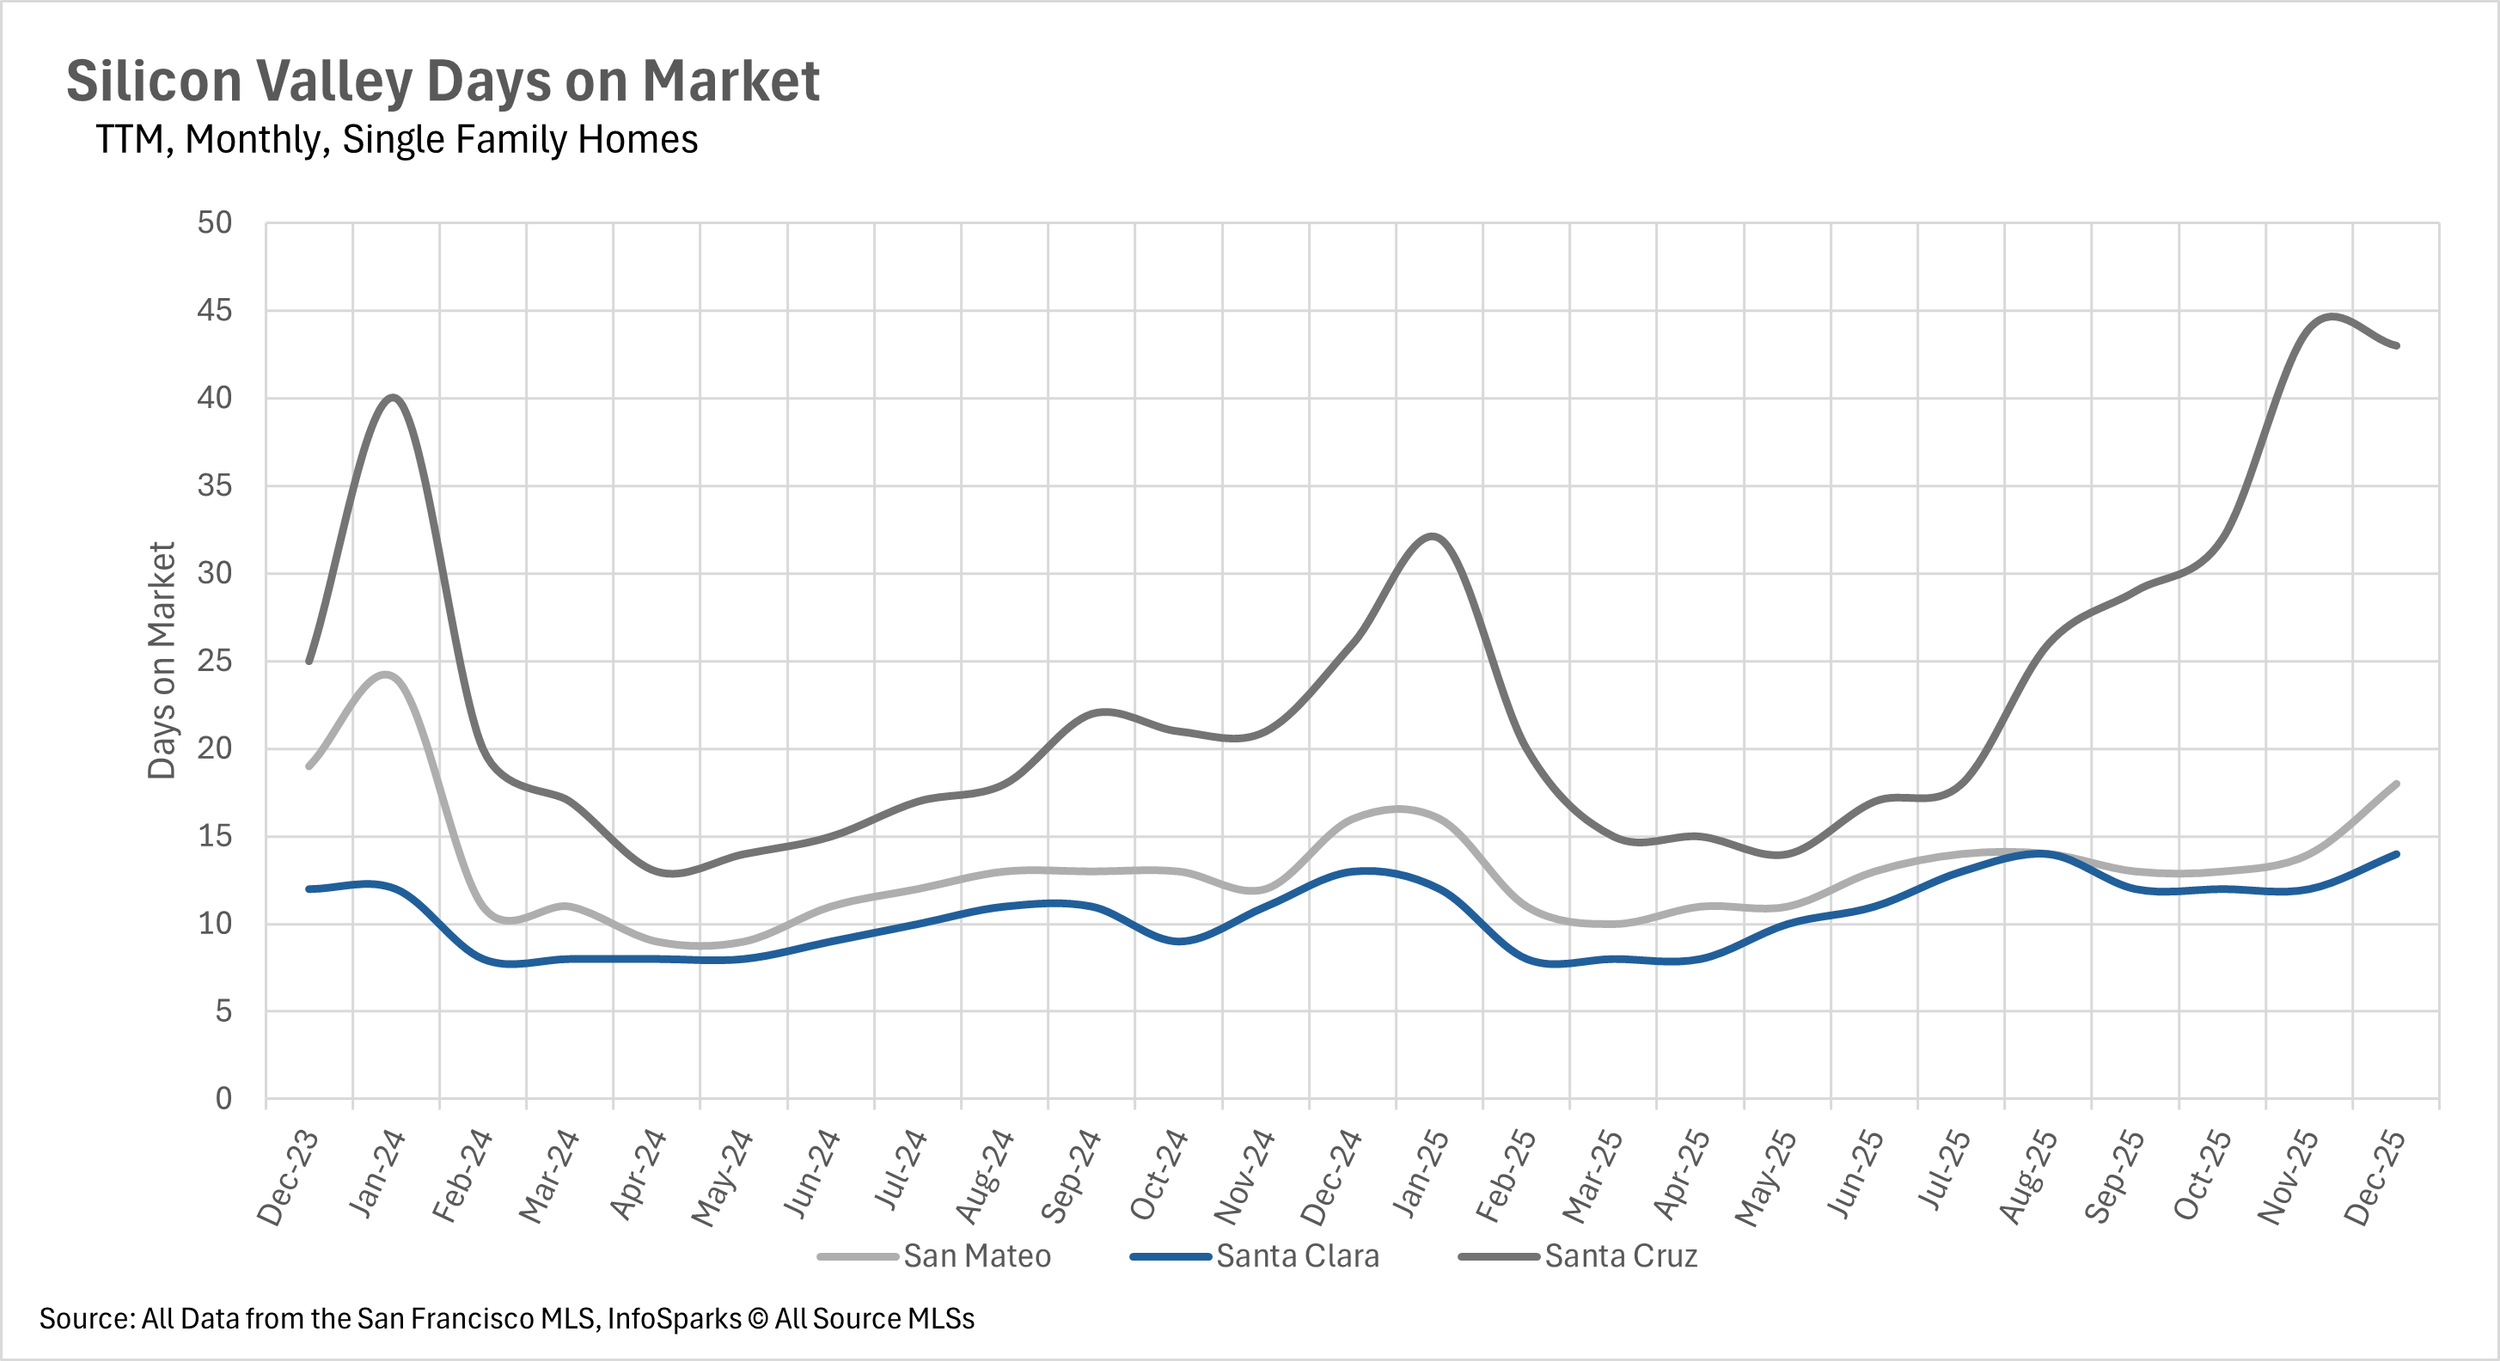
Despite the inventory crunch, listings in Santa Cruz County are spending significantly more time on the market compared to last year.
Note: You can find the charts/graphs for the Local Lowdown at the end of this section.
A December rebound brings prices back up across most of Silicon Valley
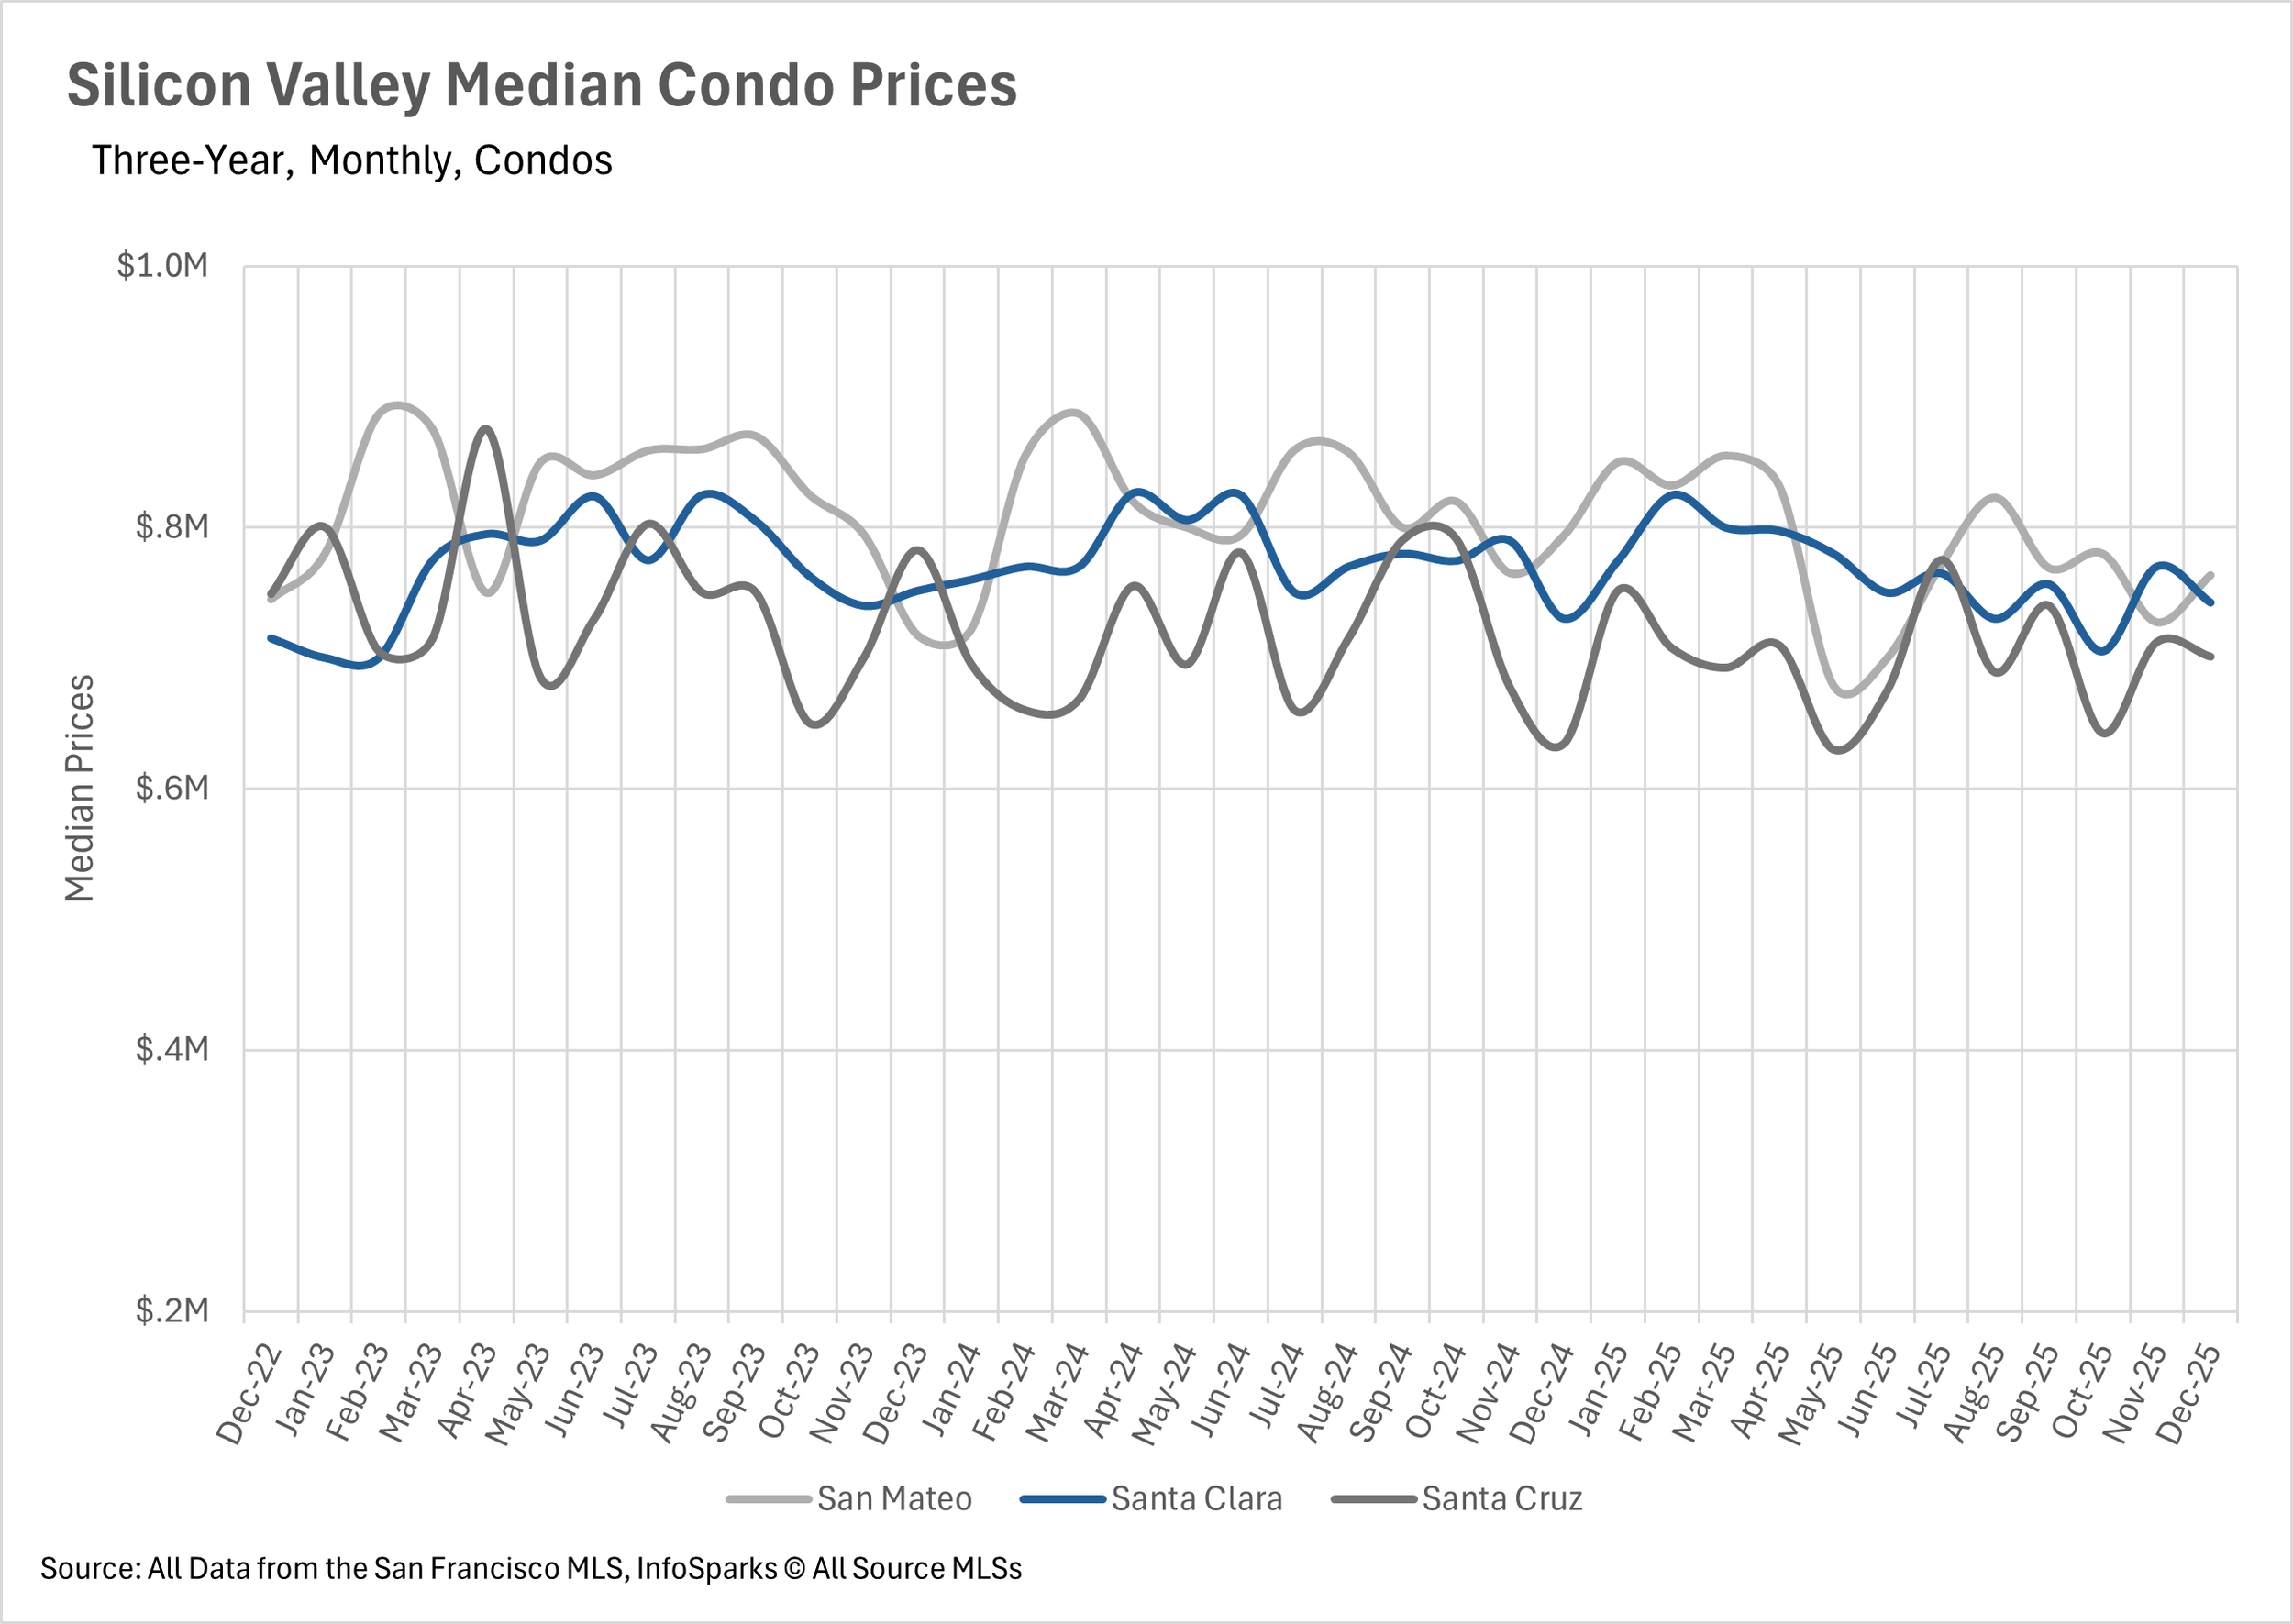
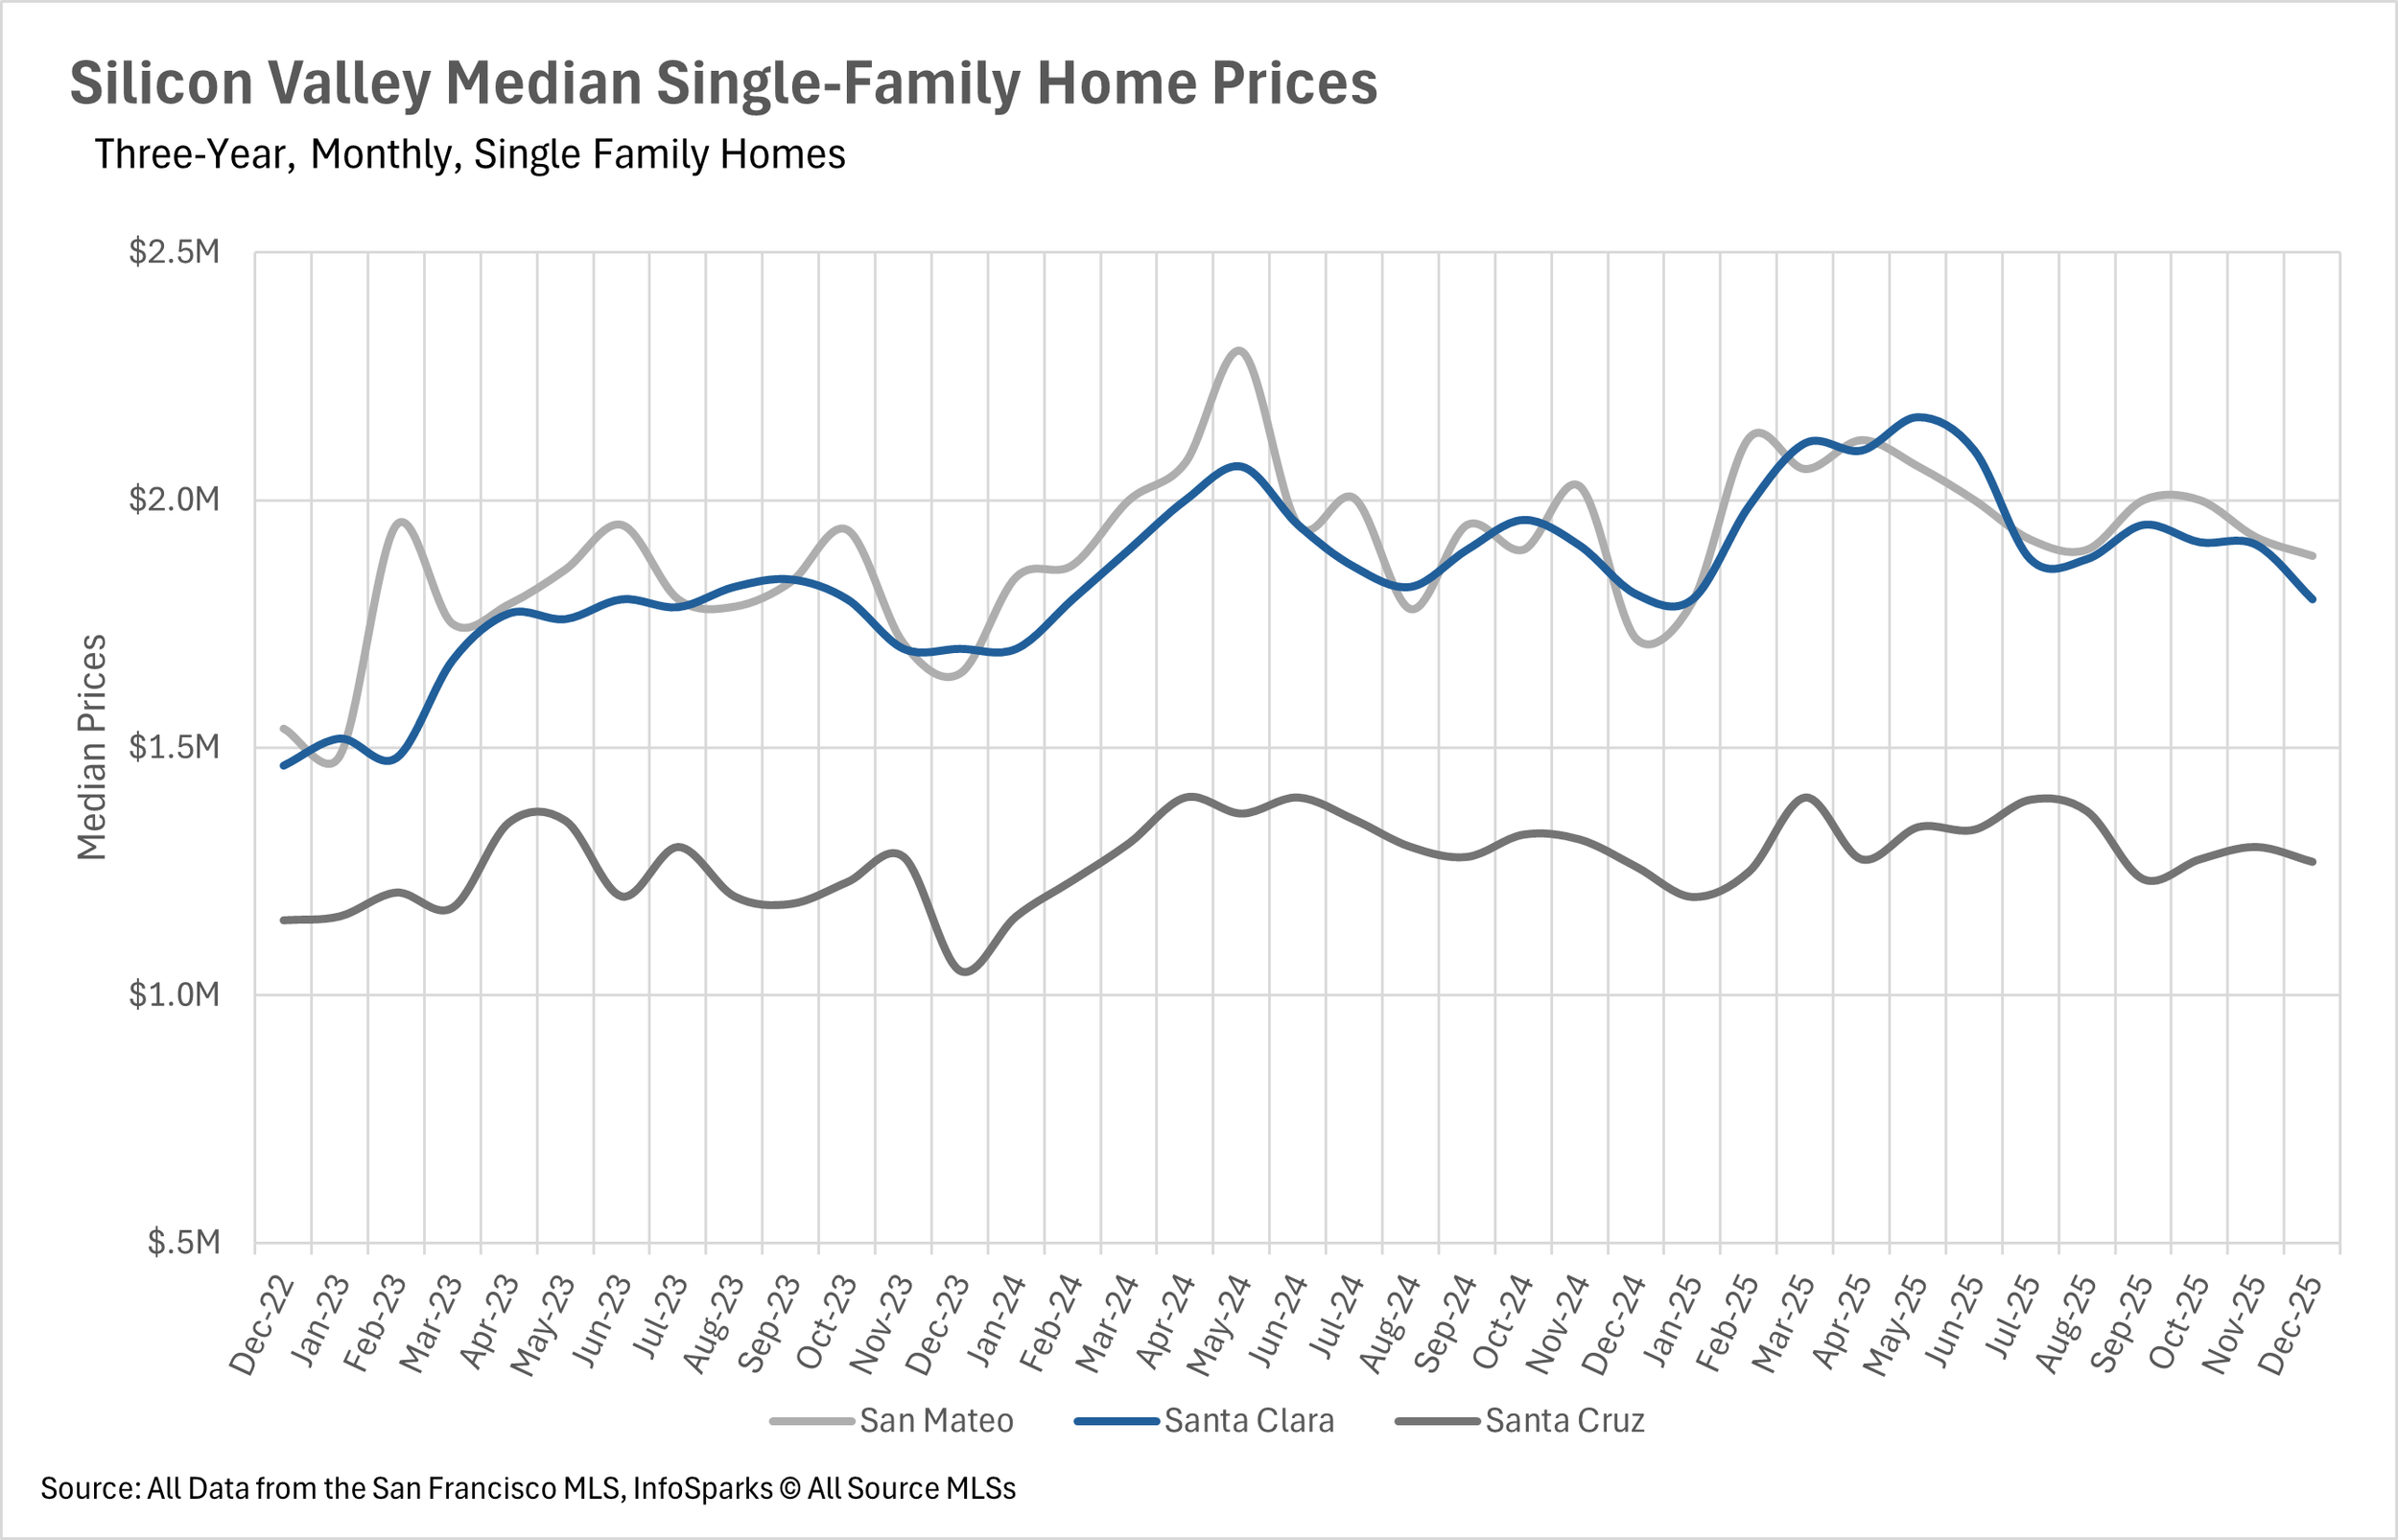
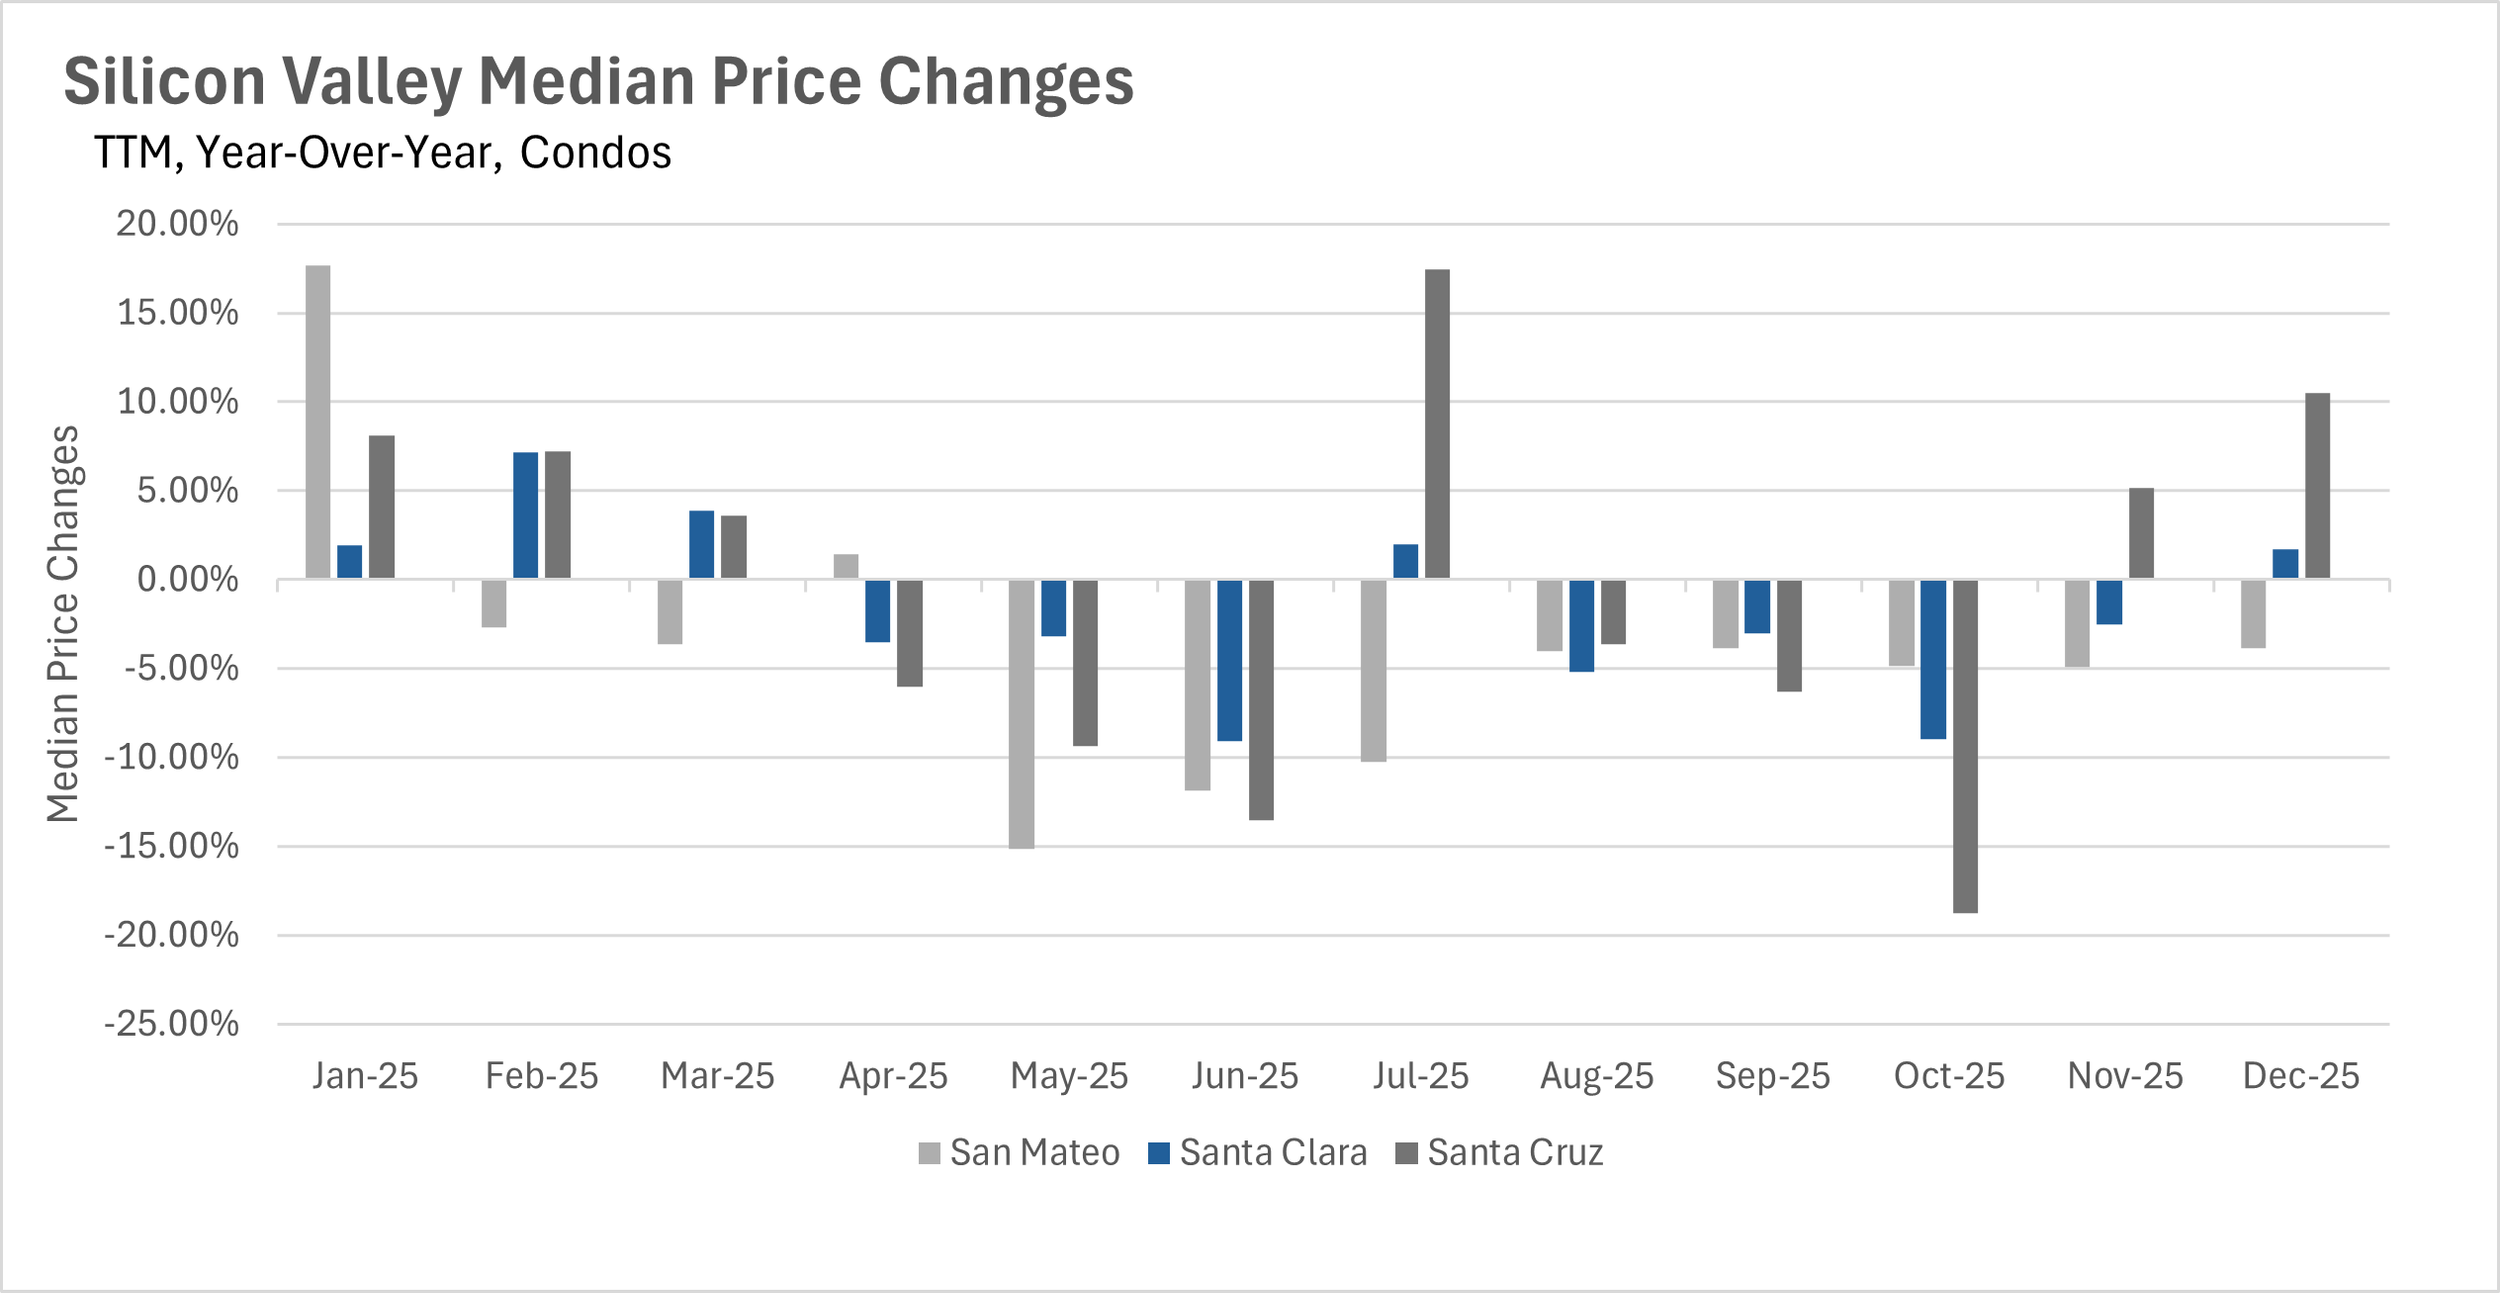
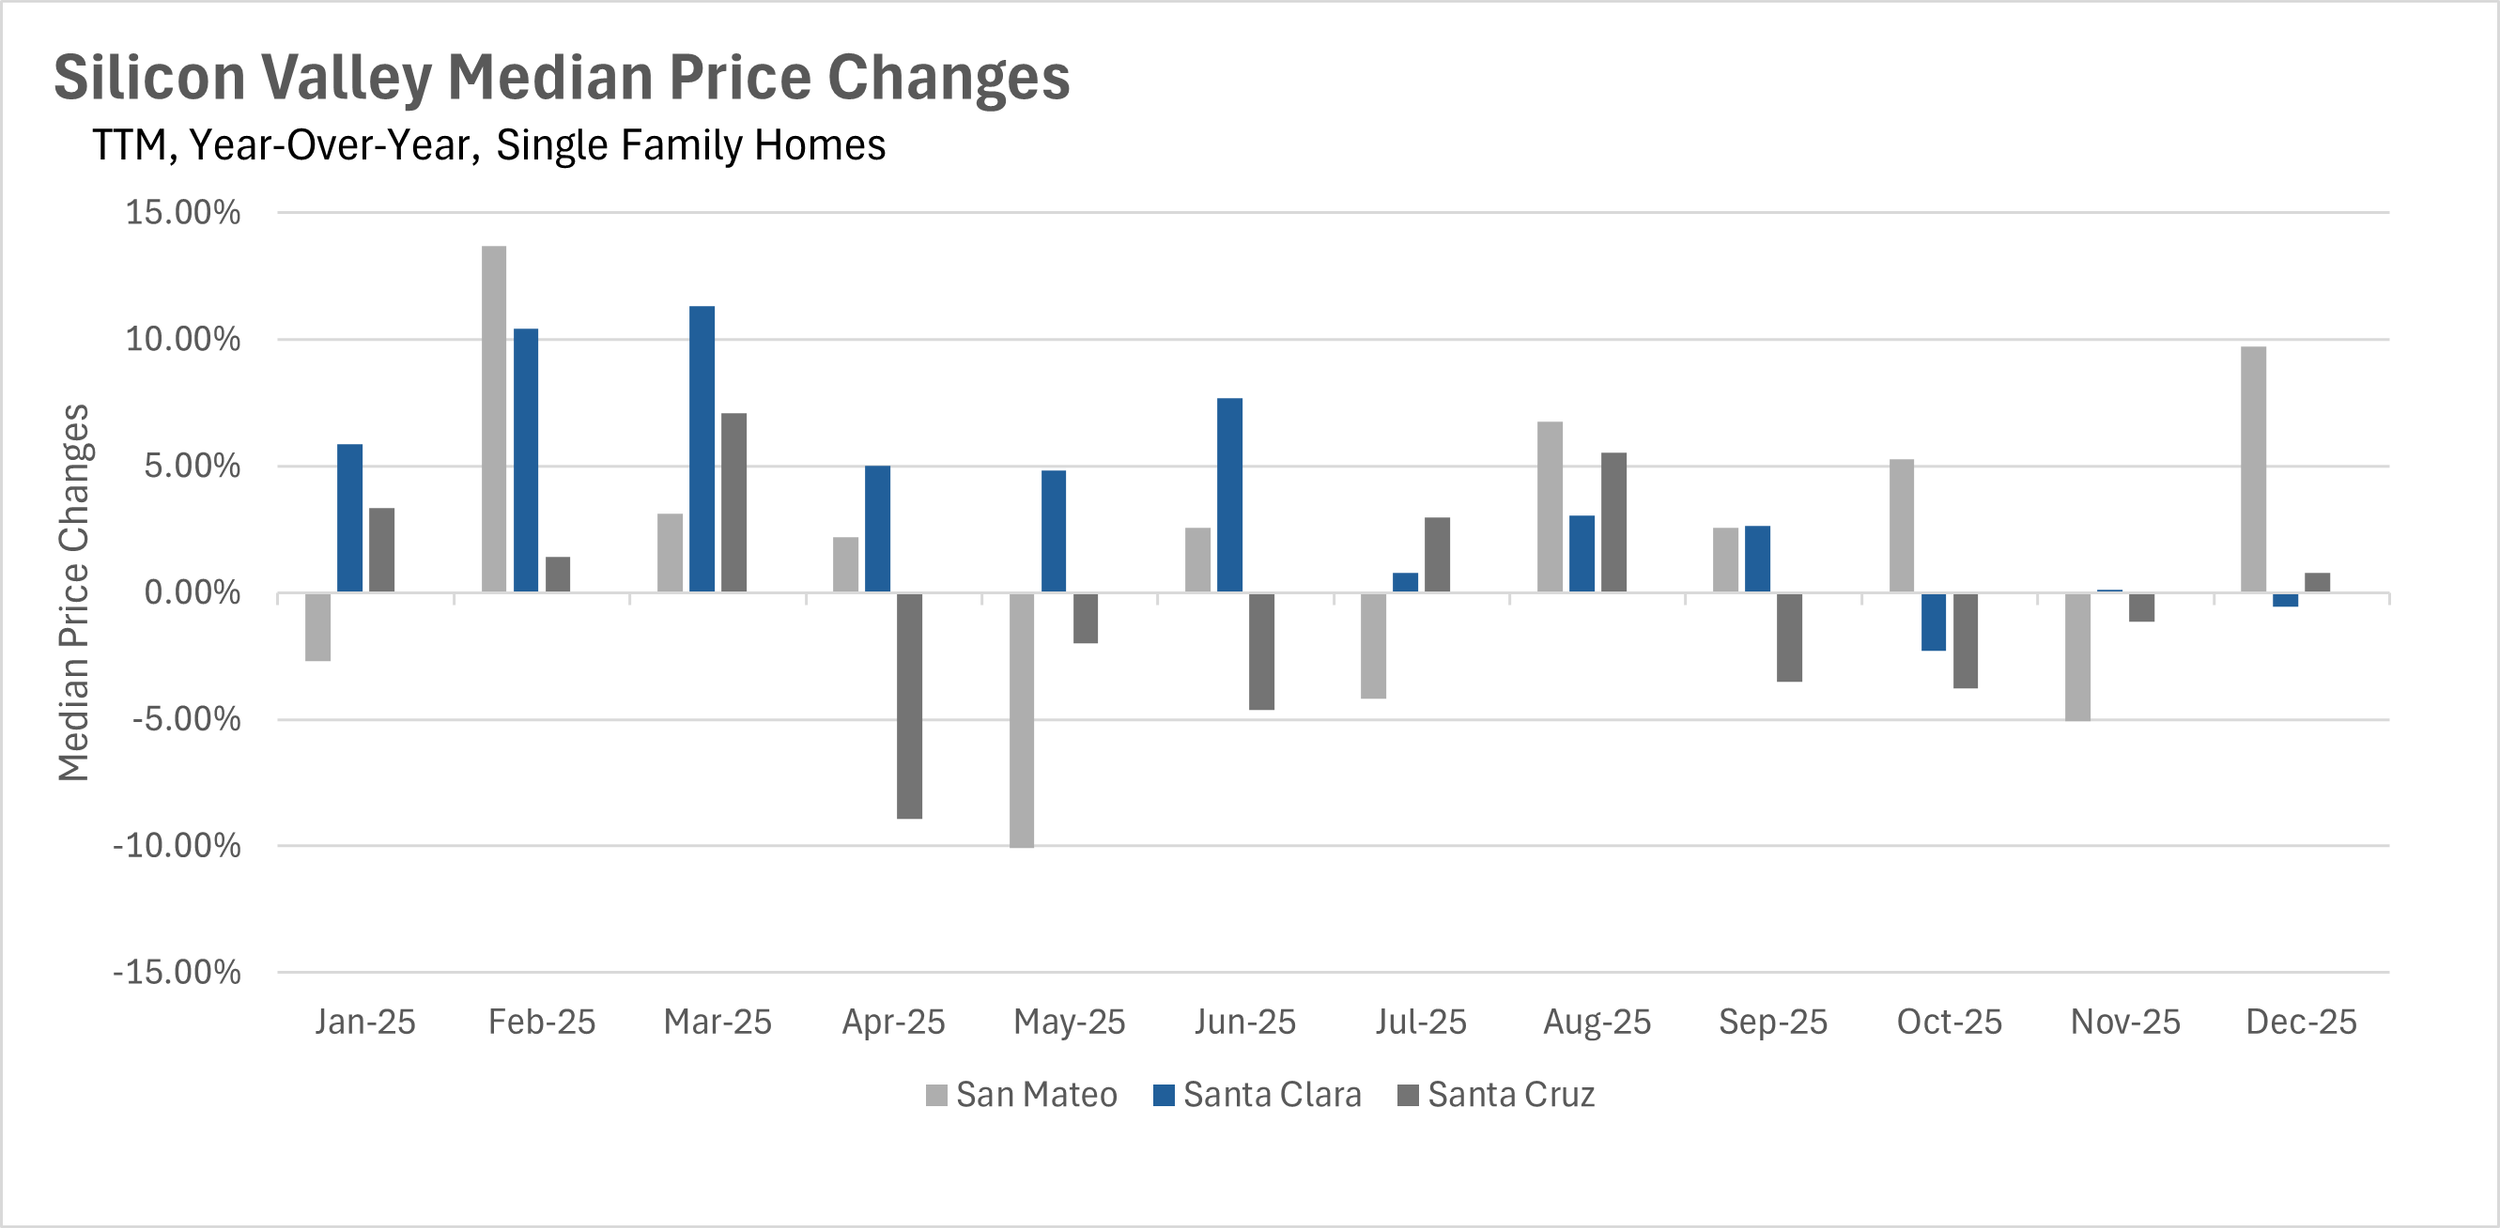
After November's rare across-the-board price declines, the single-family home market in Silicon Valley bounced back in a big way to close out 2025. San Mateo County led the charge with a 9.74% year-over-year increase in median sale price, bringing the median home to $1,887,500. Meanwhile, Santa Clara County saw a modest 0.55% year-over-year decline, with the median home selling for $1,800,000. Santa Cruz County remained relatively stable, posting a 0.79% year-over-year increase, with the median home selling for $1,270,000. The condo market told a slightly different story, with San Mateo County condos declining by 3.84% year-over-year, while Santa Clara County condos increased by 1.71%, and Santa Cruz County condos surged by an impressive 10.48%!
Inventory drops to critically low levels heading into the new year
The inventory situation in Silicon Valley has reached critical levels as we enter 2026. Single-family home inventory dropped by a staggering 43.01% month-over-month and 21.02% year-over-year, leaving just 823 homes for sale across the region. This represents the tightest inventory conditions we've seen in years, and it's a stark reversal from the inventory buildup we saw during the summer months. The condo market tells a similar story, with inventory down 33.04% month-over-month and essentially flat year-over-year. With so few options available, buyers will need to move quickly when they find a property that meets their needs!
Santa Cruz single-family homes are taking much longer to sell
Despite the severe inventory crunch, not all markets are seeing properties fly off the shelves. Santa Cruz County single-family homes are spending 65.38% more time on the market compared to last year, with the average home taking 43 days to sell. This stands in stark contrast to San Mateo and Santa Clara Counties, where homes are selling in just 18 and 14 days, respectively, though even these represent year-over-year increases of 12.50% and 7.69%. When we turn to the condo market, we see a mixed picture: San Mateo and Santa Clara County condos are taking slightly longer to sell (6.38% and 3.13% increases, respectively), while Santa Cruz County condos are actually moving faster, with a 16.13% year-over-year decrease in days on market.
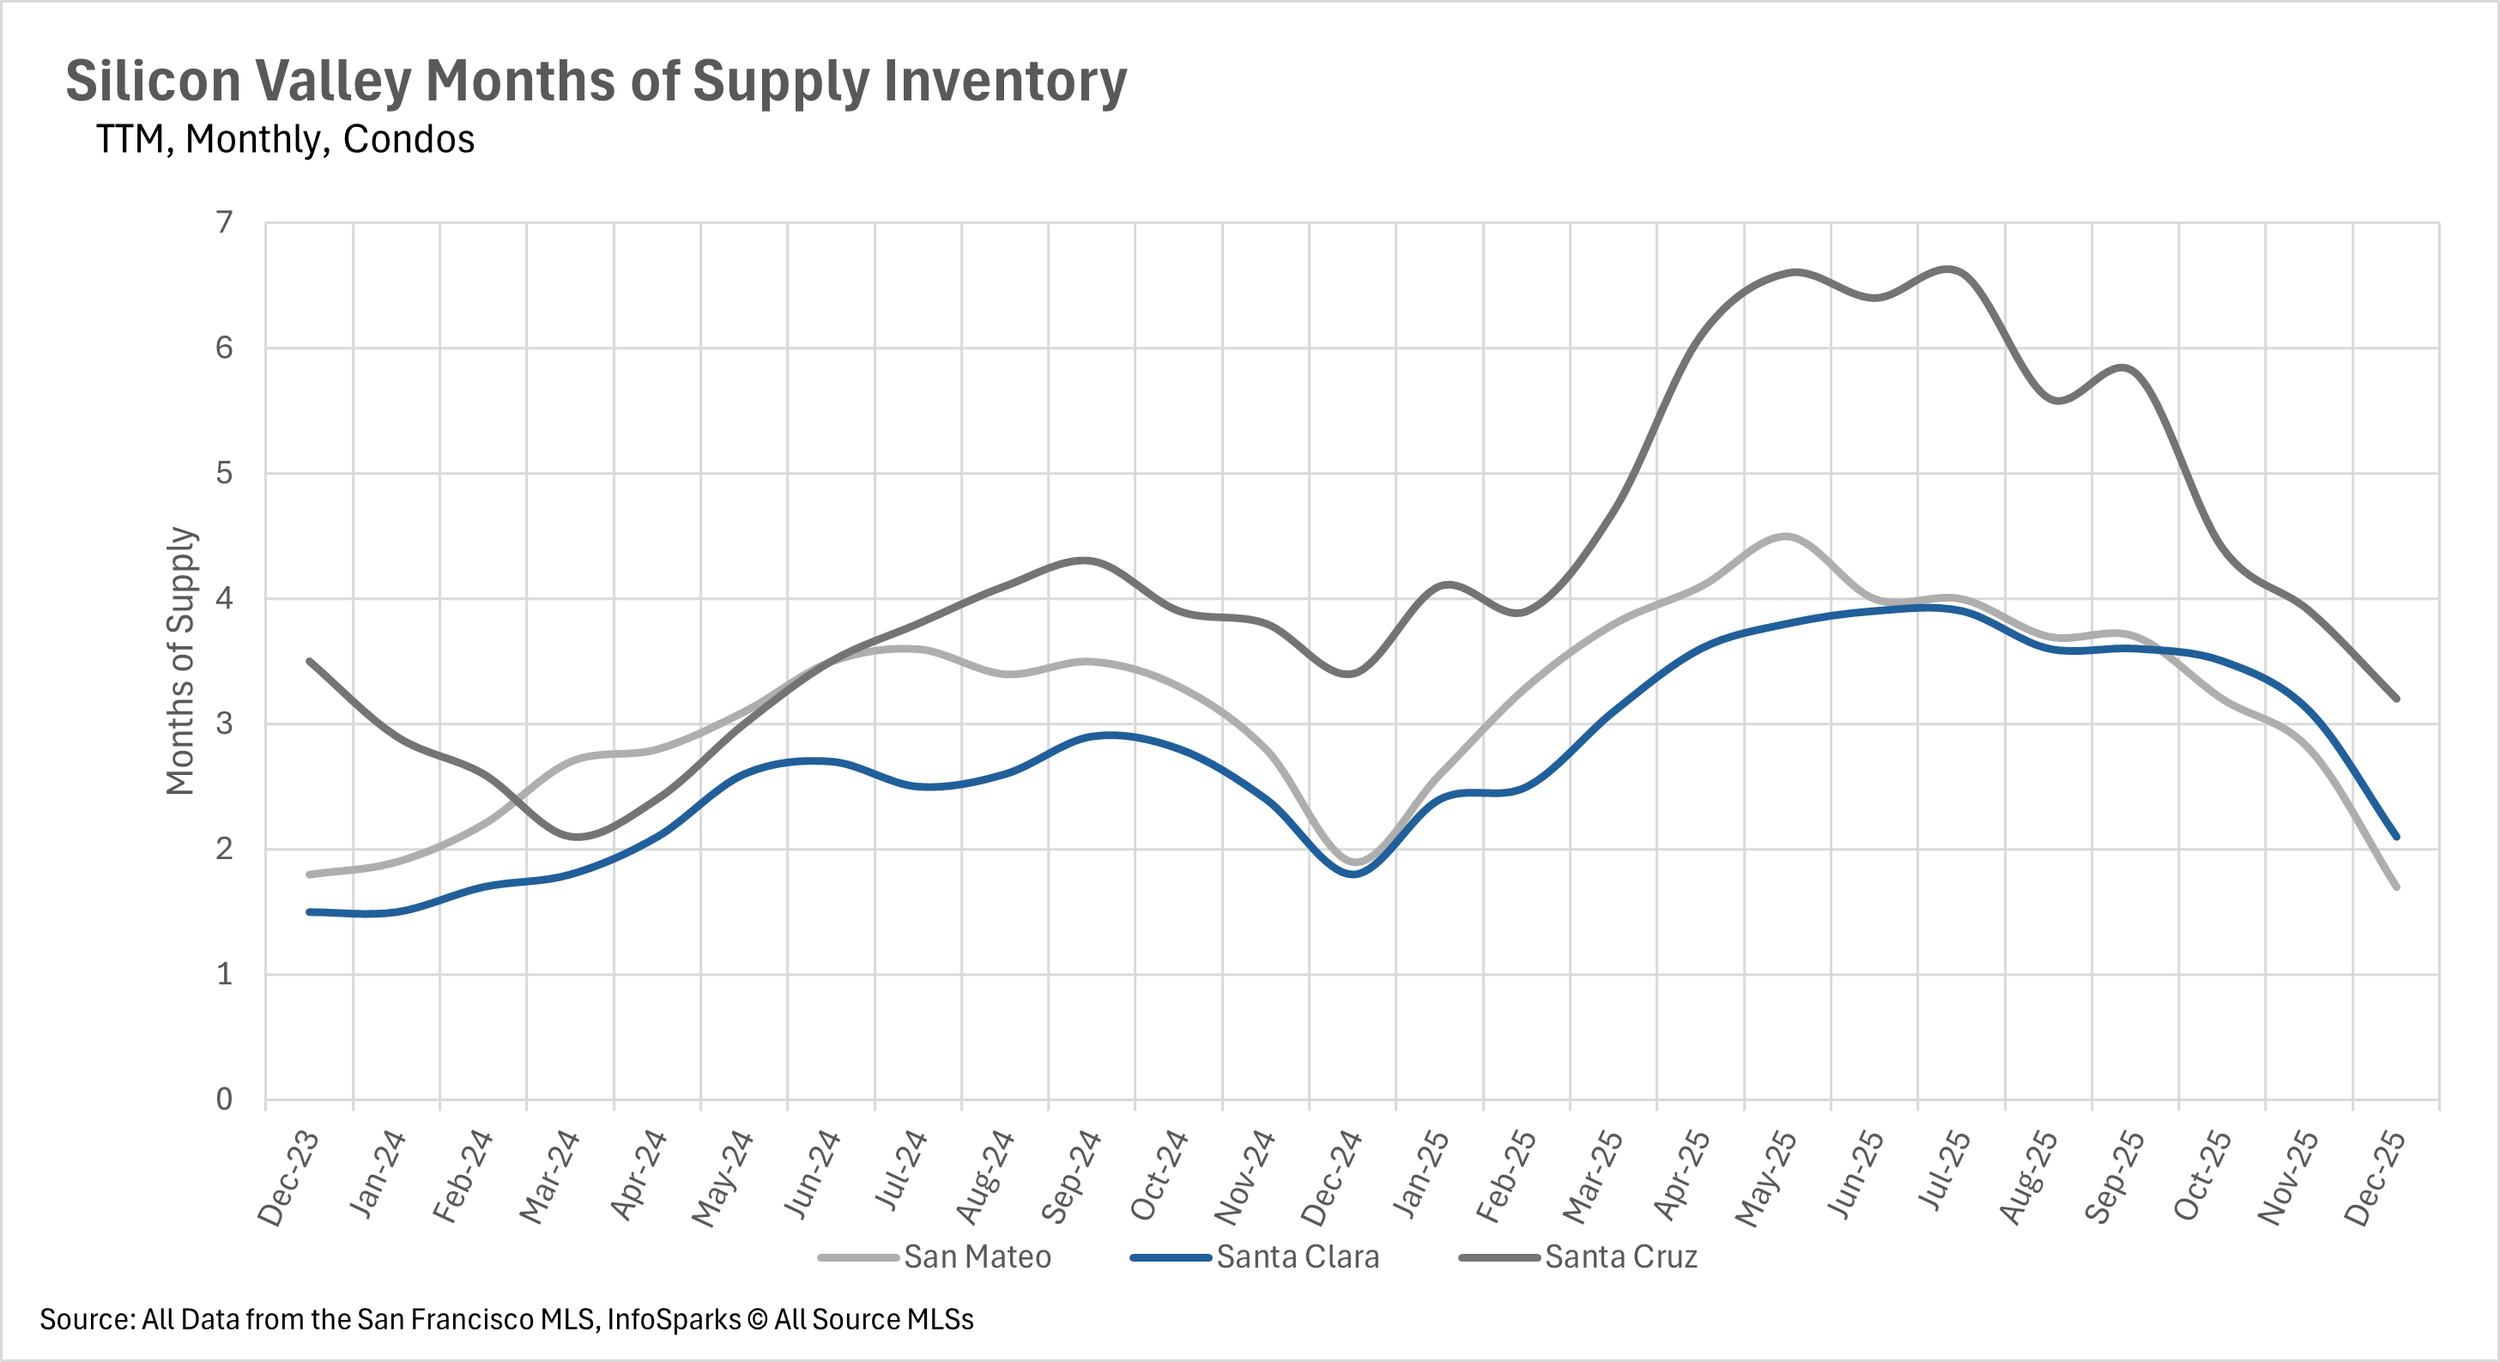
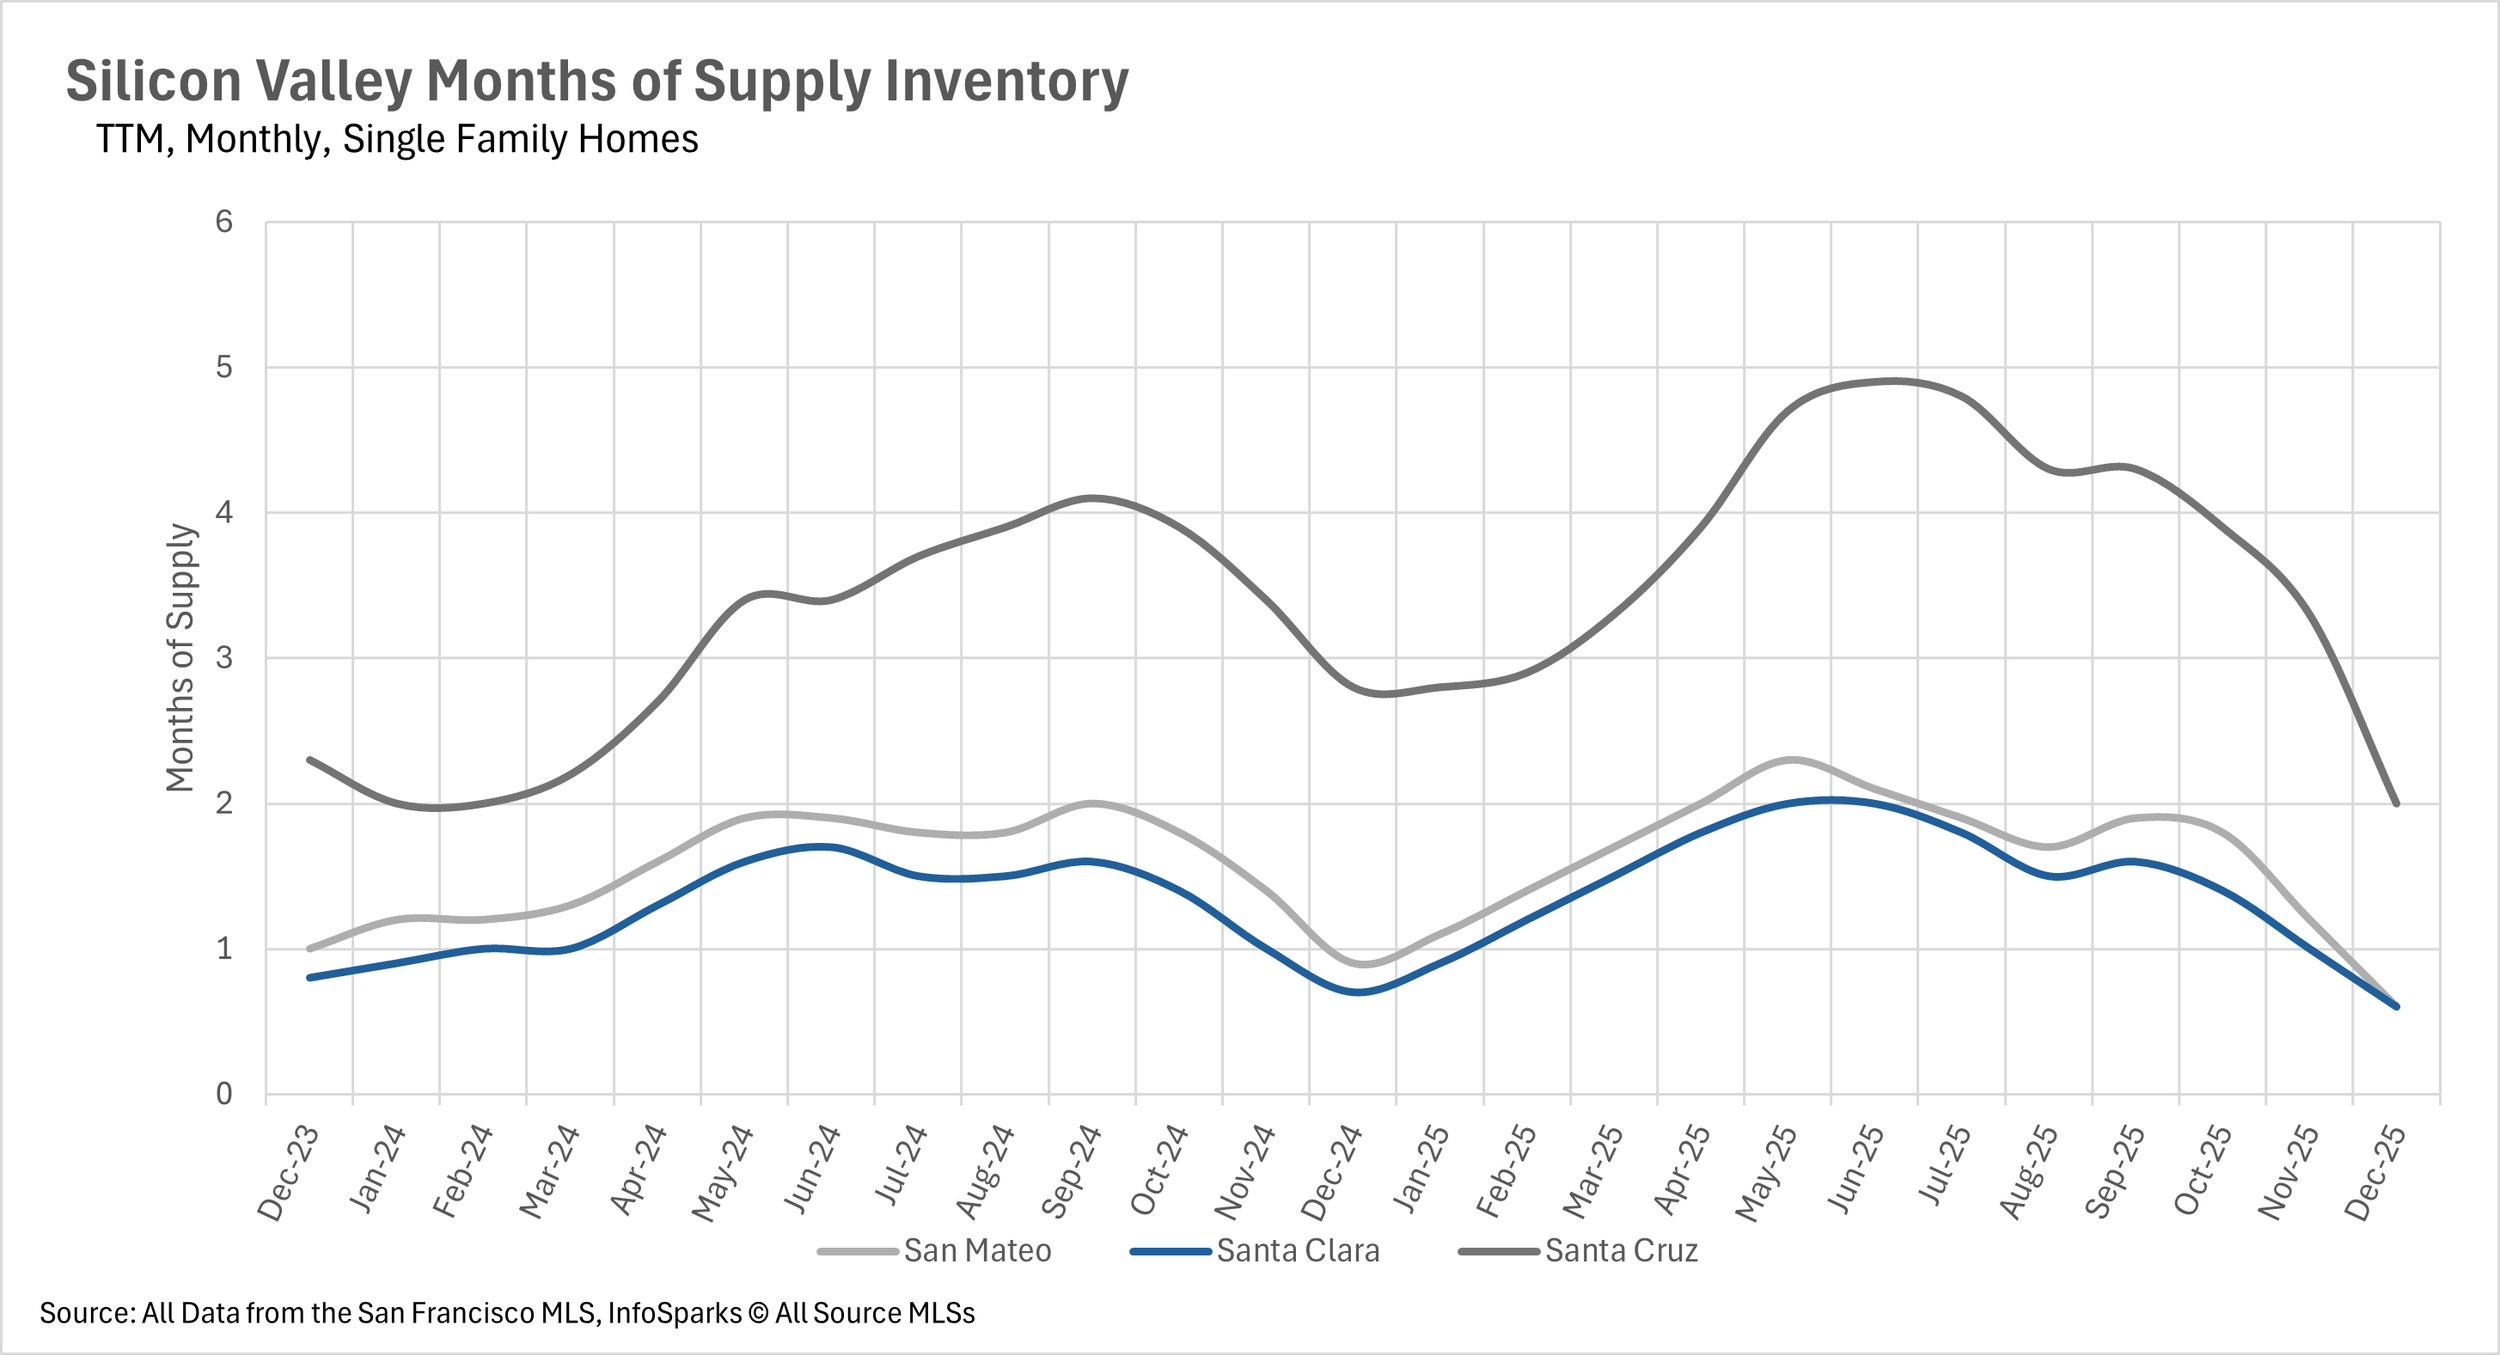
A deeply entrenched seller's market across most of Silicon Valley
When determining whether a market is a buyers’ market or a sellers’ market, we look to the Months of Supply Inventory (MSI) metric. The state of California has historically averaged around three months of MSI, so any area with at or around three months of MSI is considered a balanced market. Any market that has lower than three months of MSI is considered a sellers’ market, whereas markets with more than three months of MSI are considered buyers’ markets.
The dramatic inventory drop has pushed Silicon Valley deeper into seller's market territory than we've seen in quite some time. San Mateo and Santa Clara Counties both have just 0.6 months of single-family home supply, representing year-over-year decreases of 33.33% and 14.29%, respectively. Even Santa Cruz County, which has maintained higher inventory levels throughout the year, has dropped to just 2 months of supply, a 28.57% year-over-year decrease. The condo market offers slightly more balance, with San Mateo County at 1.7 months, Santa Clara County at 2.1 months, and Santa Cruz County at 3.2 months of supply. However, with inventory continuing to dwindle and demand remaining strong, buyers should expect stiff competition heading into the spring market!