MarketTracker Silicon Valley - December 2025 from CharlieBrownSF

The Big Story
Quick Take:
Mortgage rates continue to slowly move downwards, as the Federal Reserve continues its rate cuts.
Inventories remain high, as new supply is hitting the market faster than existing homes are being sold.
Last Wednesday, the Fed lowered the federal funds rate by another 25 basis points, bringing the target range to 3.50%-3.75%.
Note: You can find the charts & graphs for the Big Story at the end of the following section.
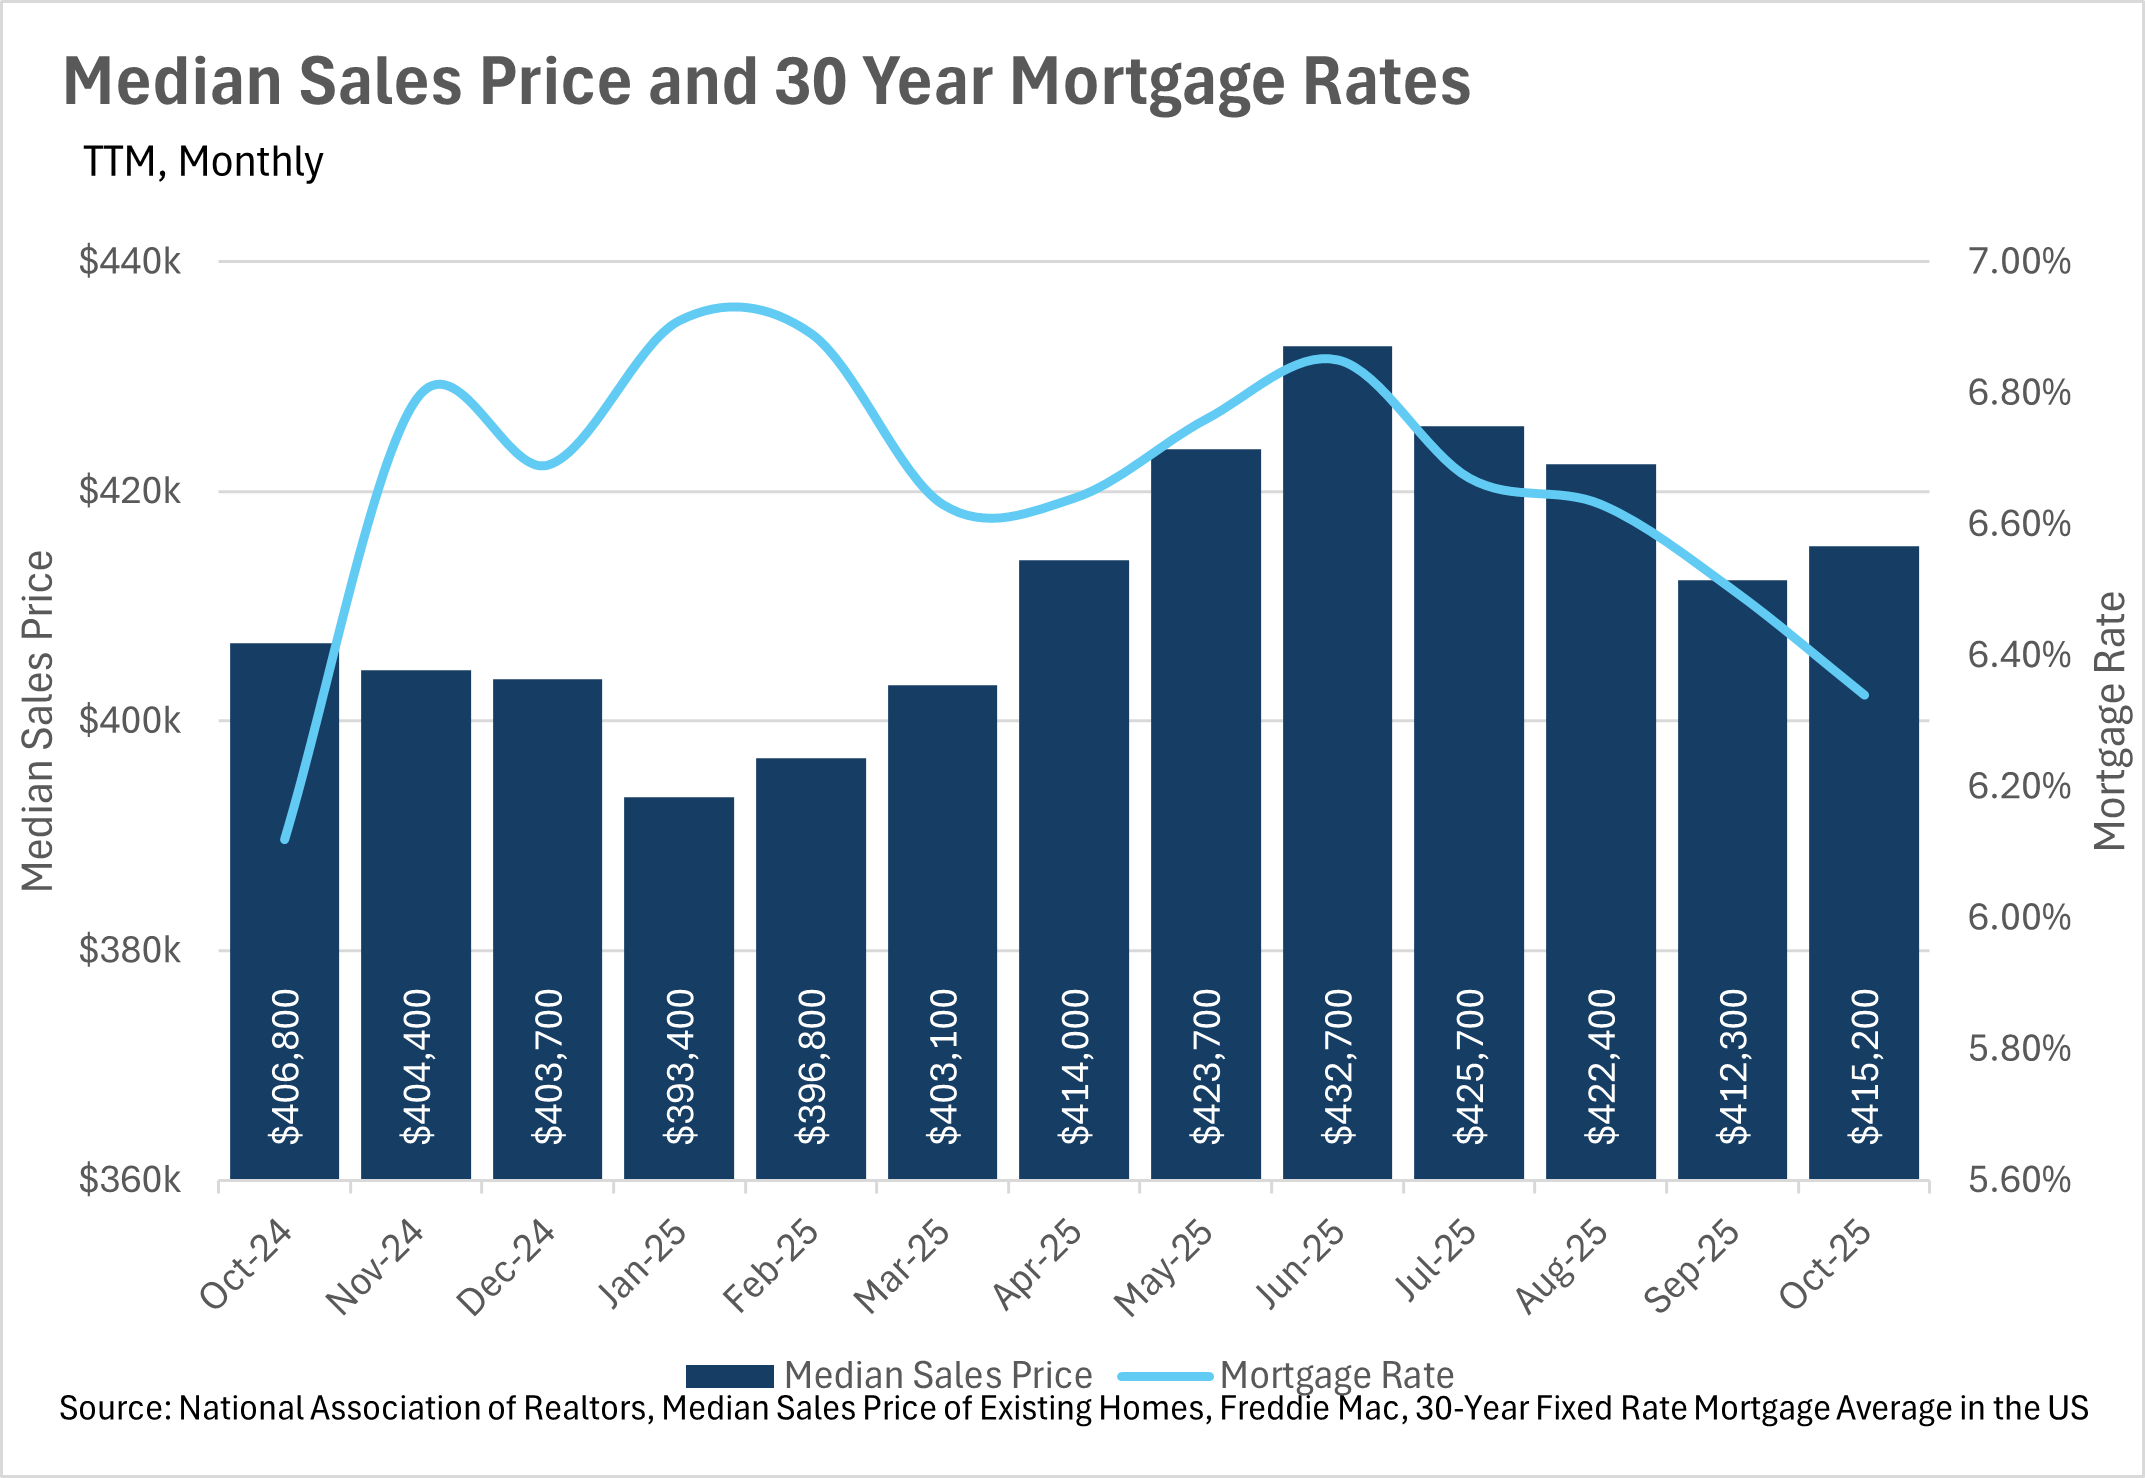
*National Association of REALTORS® data is released two months behind, so we estimate the most recent month's data when possible and appropriate.
Although they are on the decline, interest rates remain much higher than the inflation rate
Unfortunately, we have yet to see mortgage rates drop below the 6% mark, as the Federal Reserve continues its cutting cycle, after its third consecutive cut to the federal funds rate in December. Although many are hopeful that we will continue to see rate cuts into 2026, the future of the federal funds rate is relatively uncertain. While there’s still roughly a month and a half before the next interest rate decision, CME’s FedWatch tool is predicting roughly a 25% chance that we see another rate cut in January. As we all know, the federal funds rate is the most important factor in the determination of interest rates, so paying attention to what the Fed is doing is pivotal! We’ll likely see an increase in the probability of another rate cut if some of the new/delayed economic data that’s coming out provides a cause for concern.
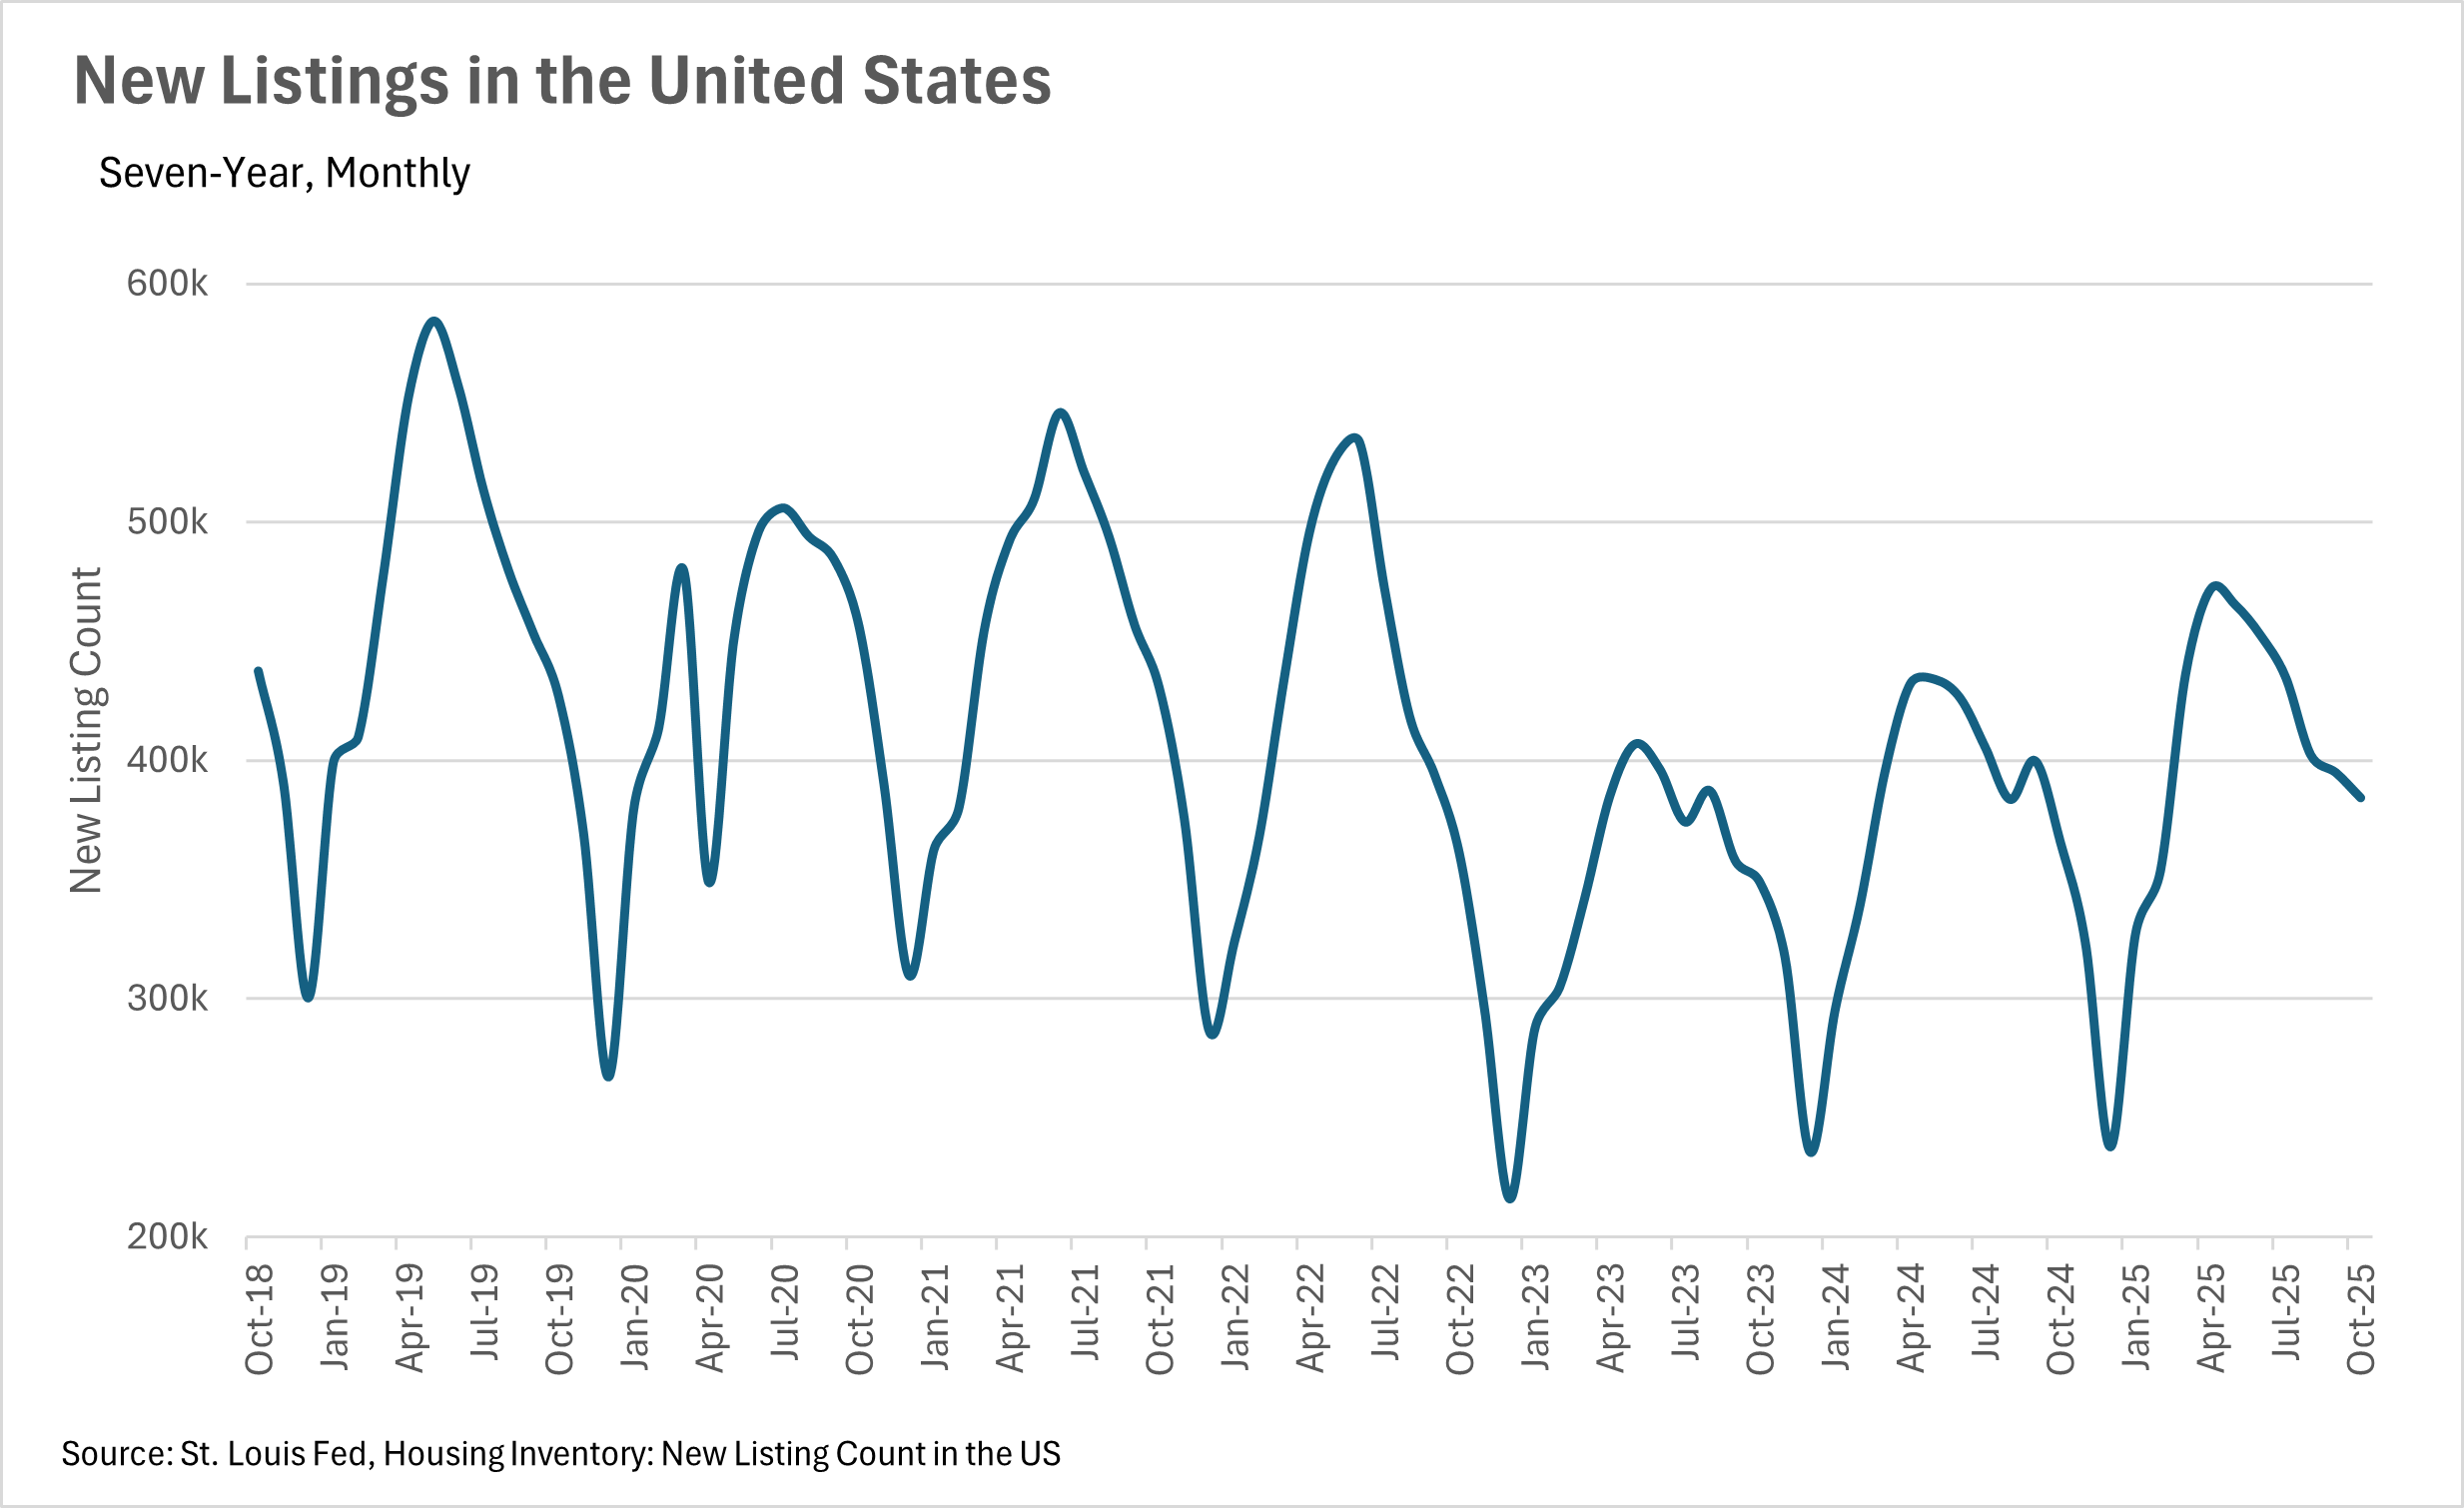
Inventory levels have remained remarkably steady throughout the entire year
Throughout much of the year, inventories at a national level have remained remarkably steady, with most months hovering near the 1.5 million mark. With that being said, in the month of October, we saw inventory levels at roughly 1,520,000, representing a 10.95% increase on a year-over-year basis. During that same time period, we saw more than 384,000 new homes hit the market, representing an increase of 5.08% on a year-over-year basis. We also saw the median sale price for a home increase by 2.06%, bringing the median home value to $415,200.
The Fed continues to cut rates, as the broader market faces uncertainty
Right now, we’re in the midst of a relatively interesting period of time, economically speaking. During the government shutdown, not only were there very few publicly released economic datapoints, but many offices responsible for collecting data were unable to. This means we’re receiving economic data that has been tremendously delayed. Uncertainty like this, of course, does not bode well with countless entities, like lenders, markets, and most importantly, the Federal Reserve. Since the Fed is so reliant on public data that has been inaccessible/delayed given the government shutdown, it’s hard to tell what they will do next with interest rates. Luckily for homebuyers and sellers alike, we saw another quarter-point cut in December, but overall, it’s unclear whether or not this cut cycle will continue.
However, this is just what we’re seeing at a national level. As we all know, real estate is incredibly localized, so be sure to check out your local lowdown below!
Big Story Data


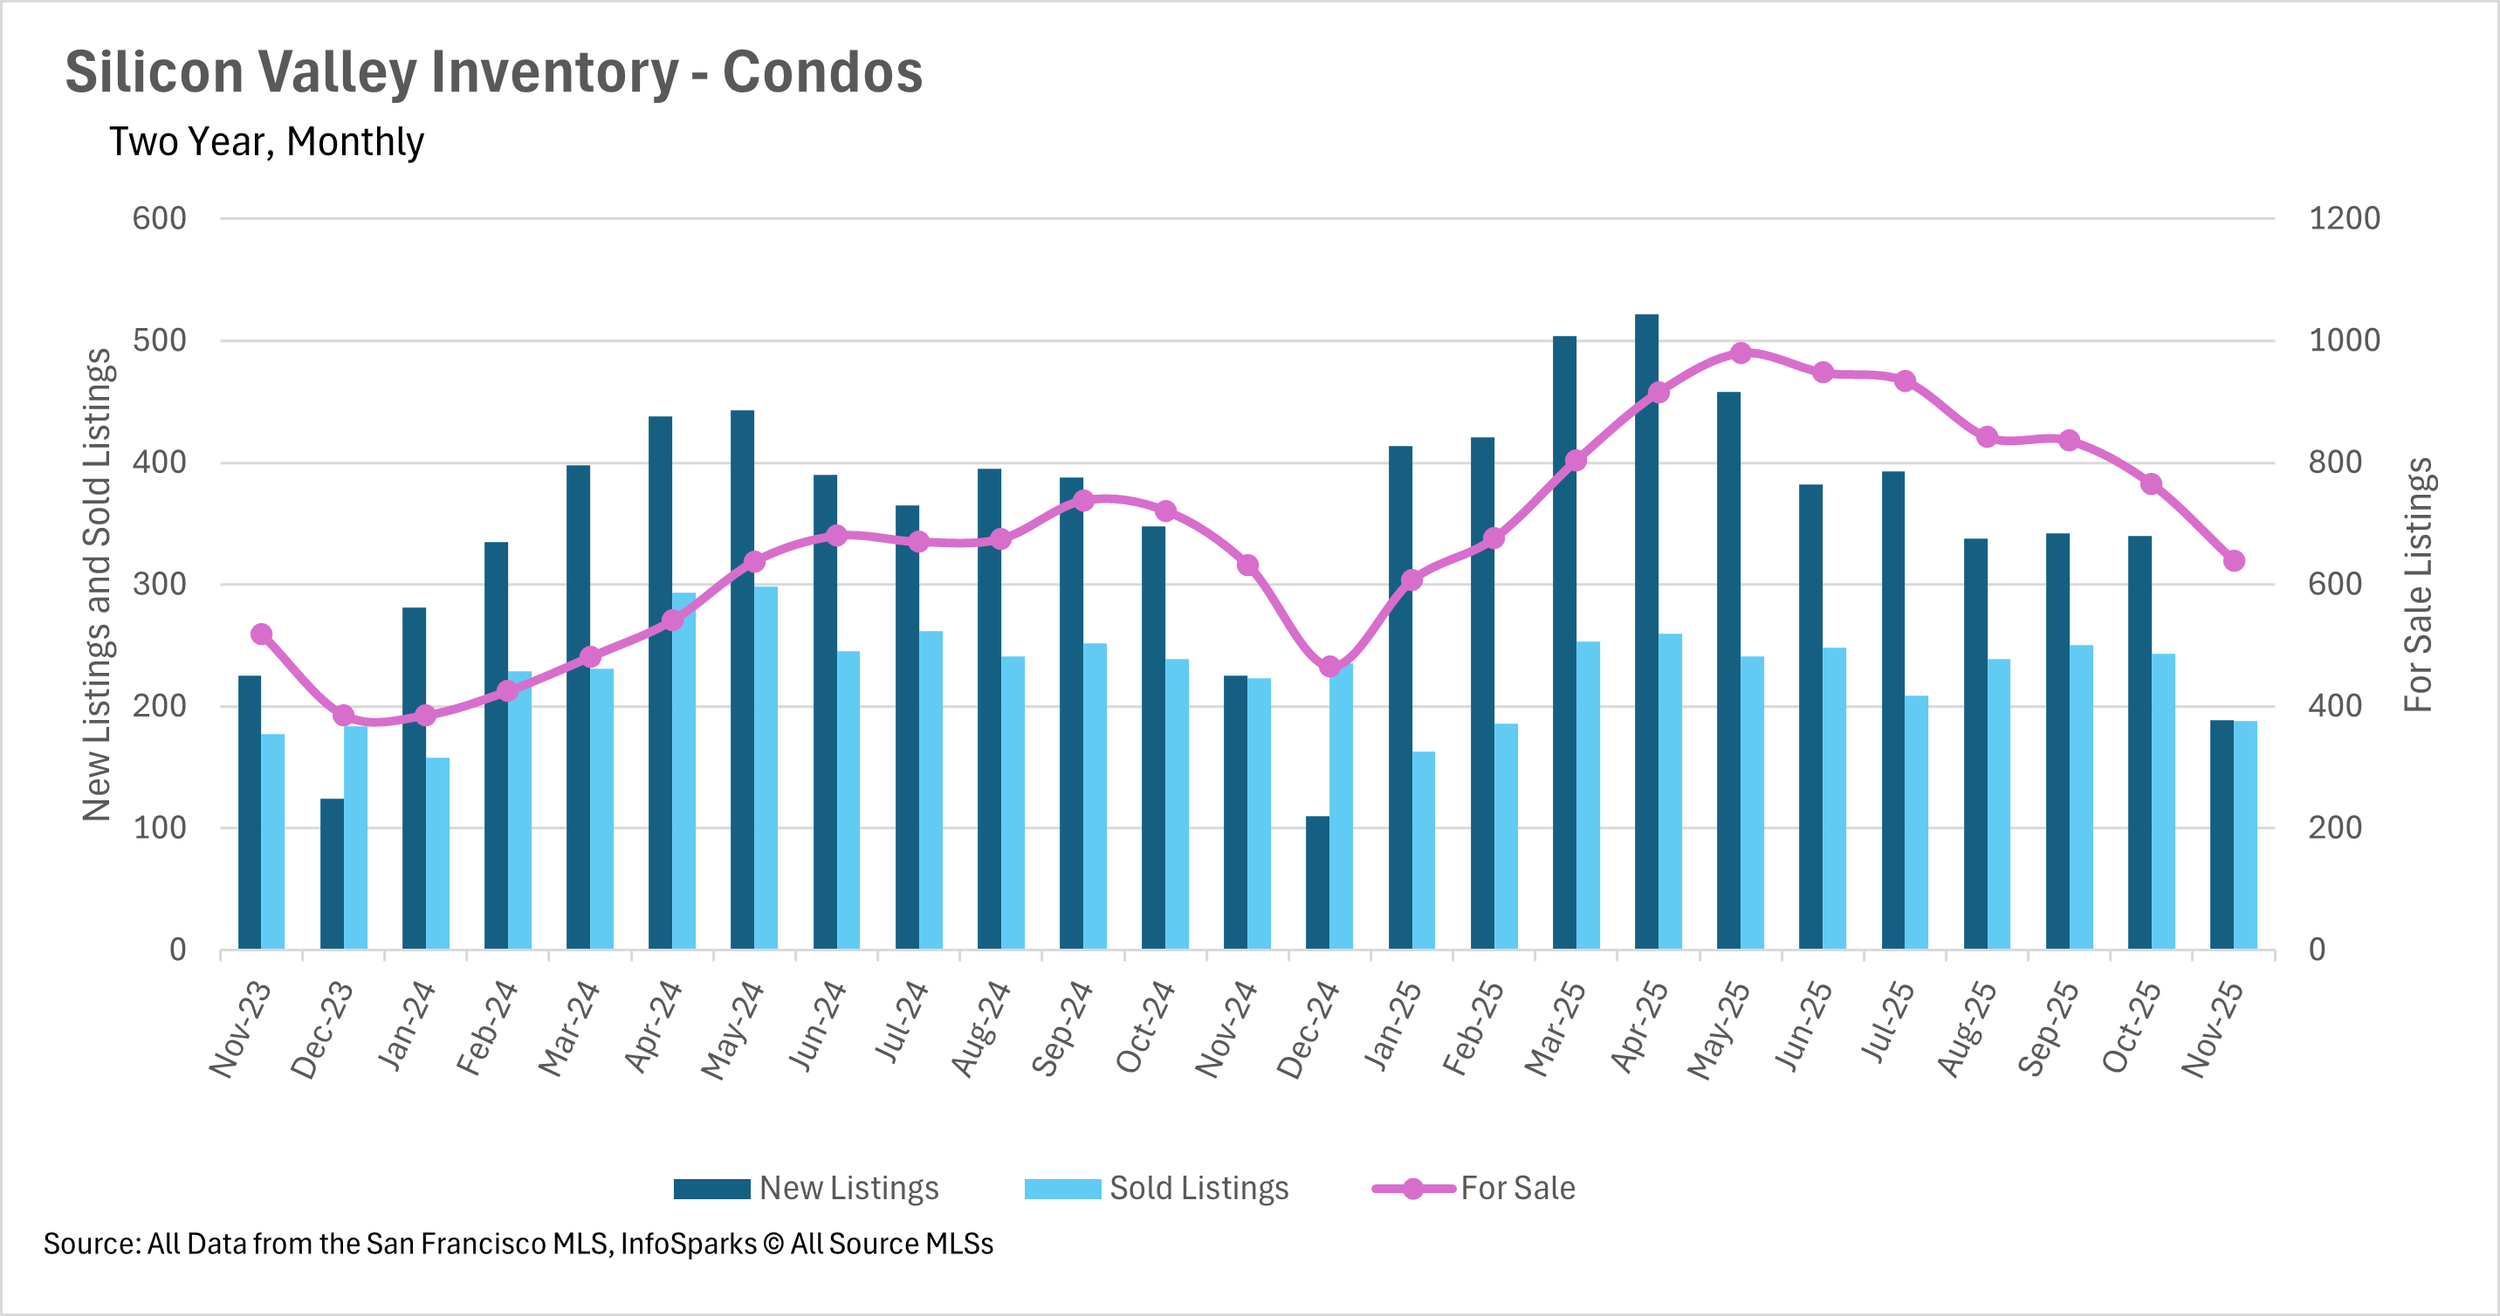
The Local Lowdown
Quick Take:
Single-family median sale prices declined across the board for the first time in more than a year in November!
Despite declines in price across the board, inventories are down more than 10% year-over-year.
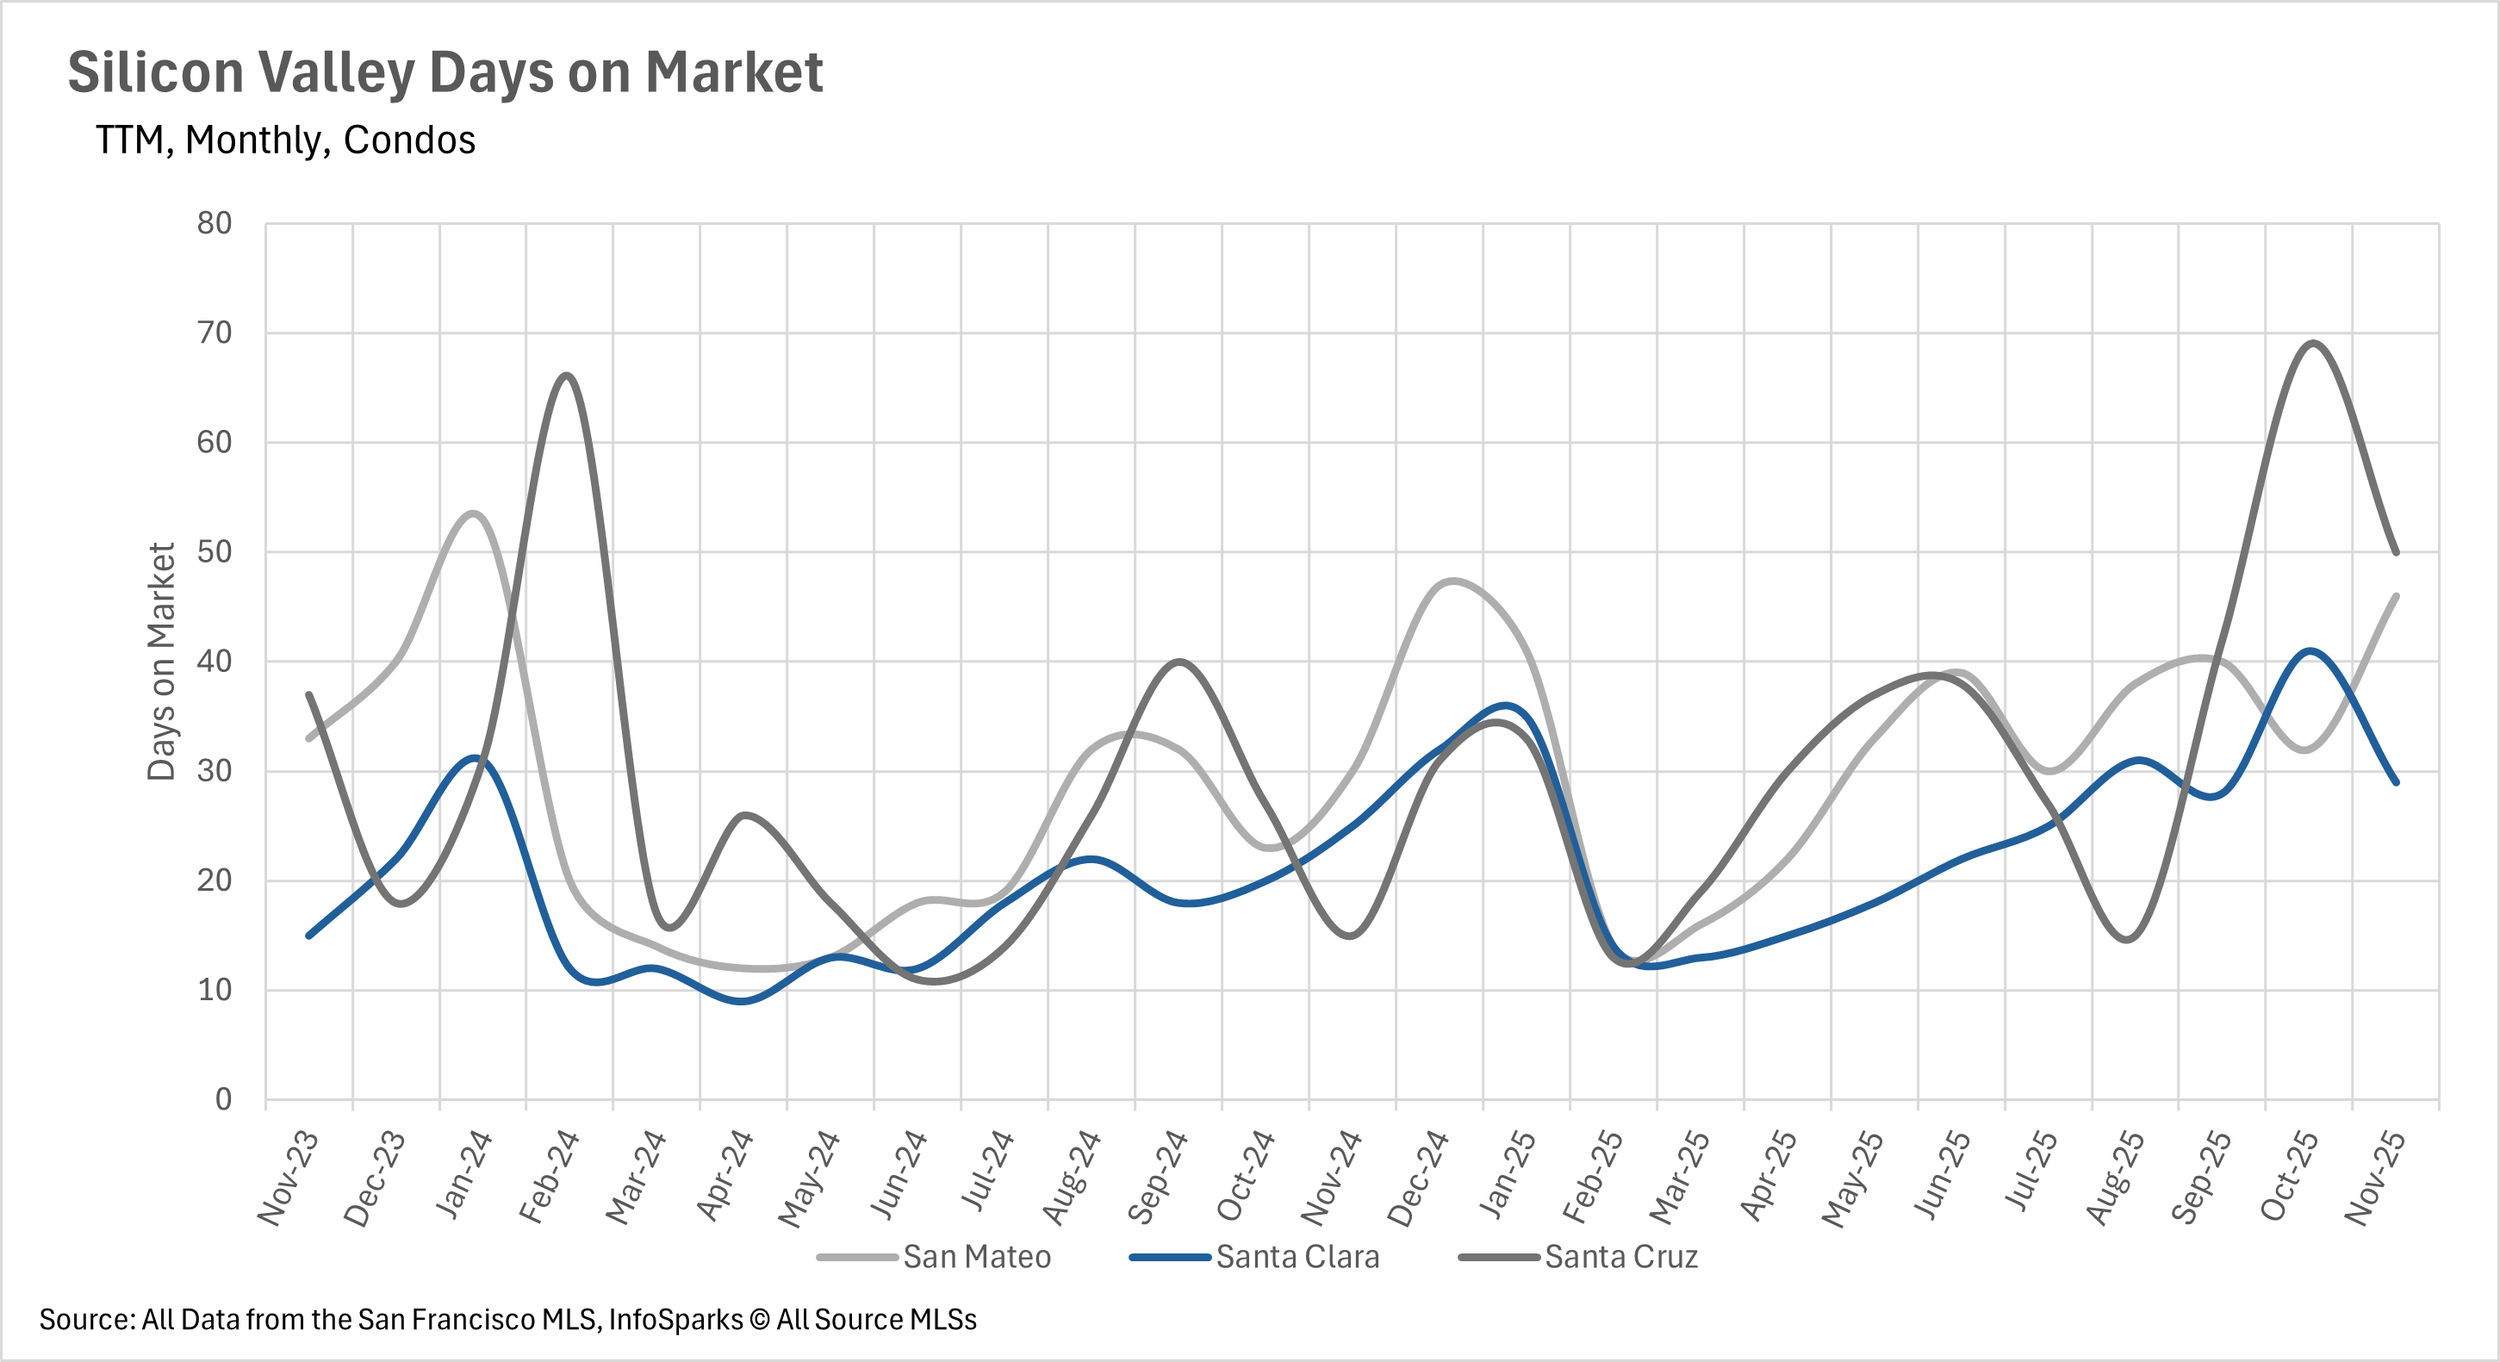
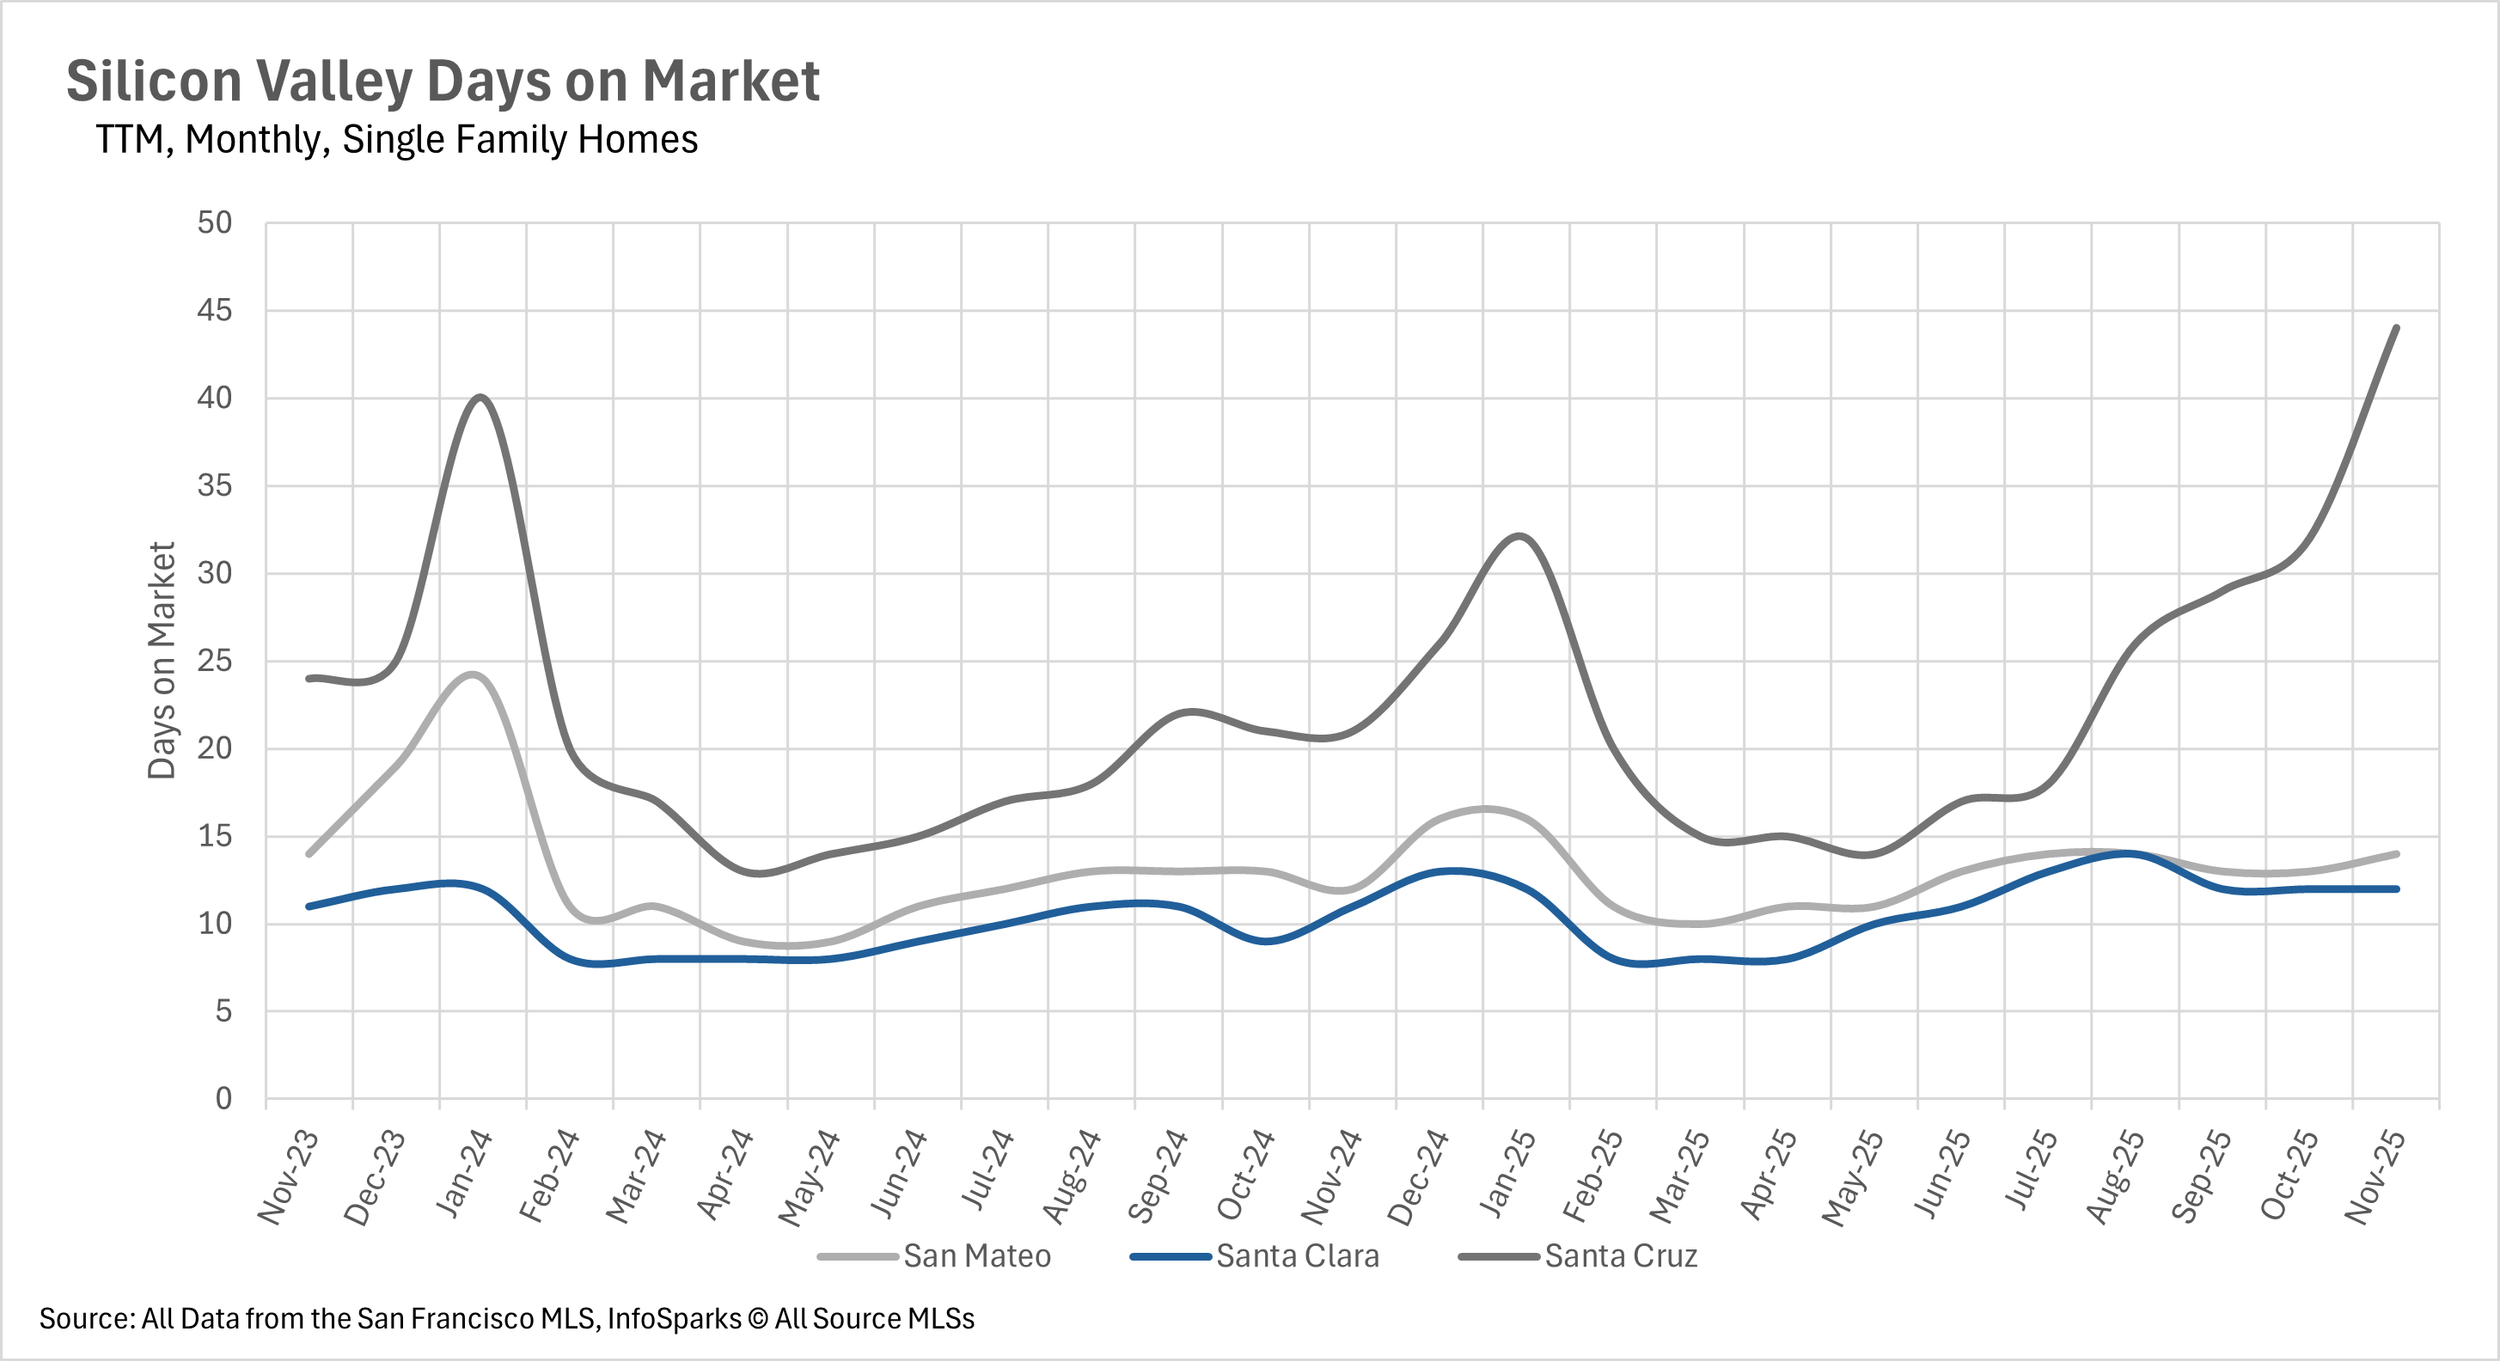
The average single-family home in Santa Cruz County is spending more than twice as much time on the market when compared to last year.
Note: You can find the charts/graphs for the Local Lowdown at the end of this section
Local Lowdown Data
Declines across the board for the first time in more than a year!
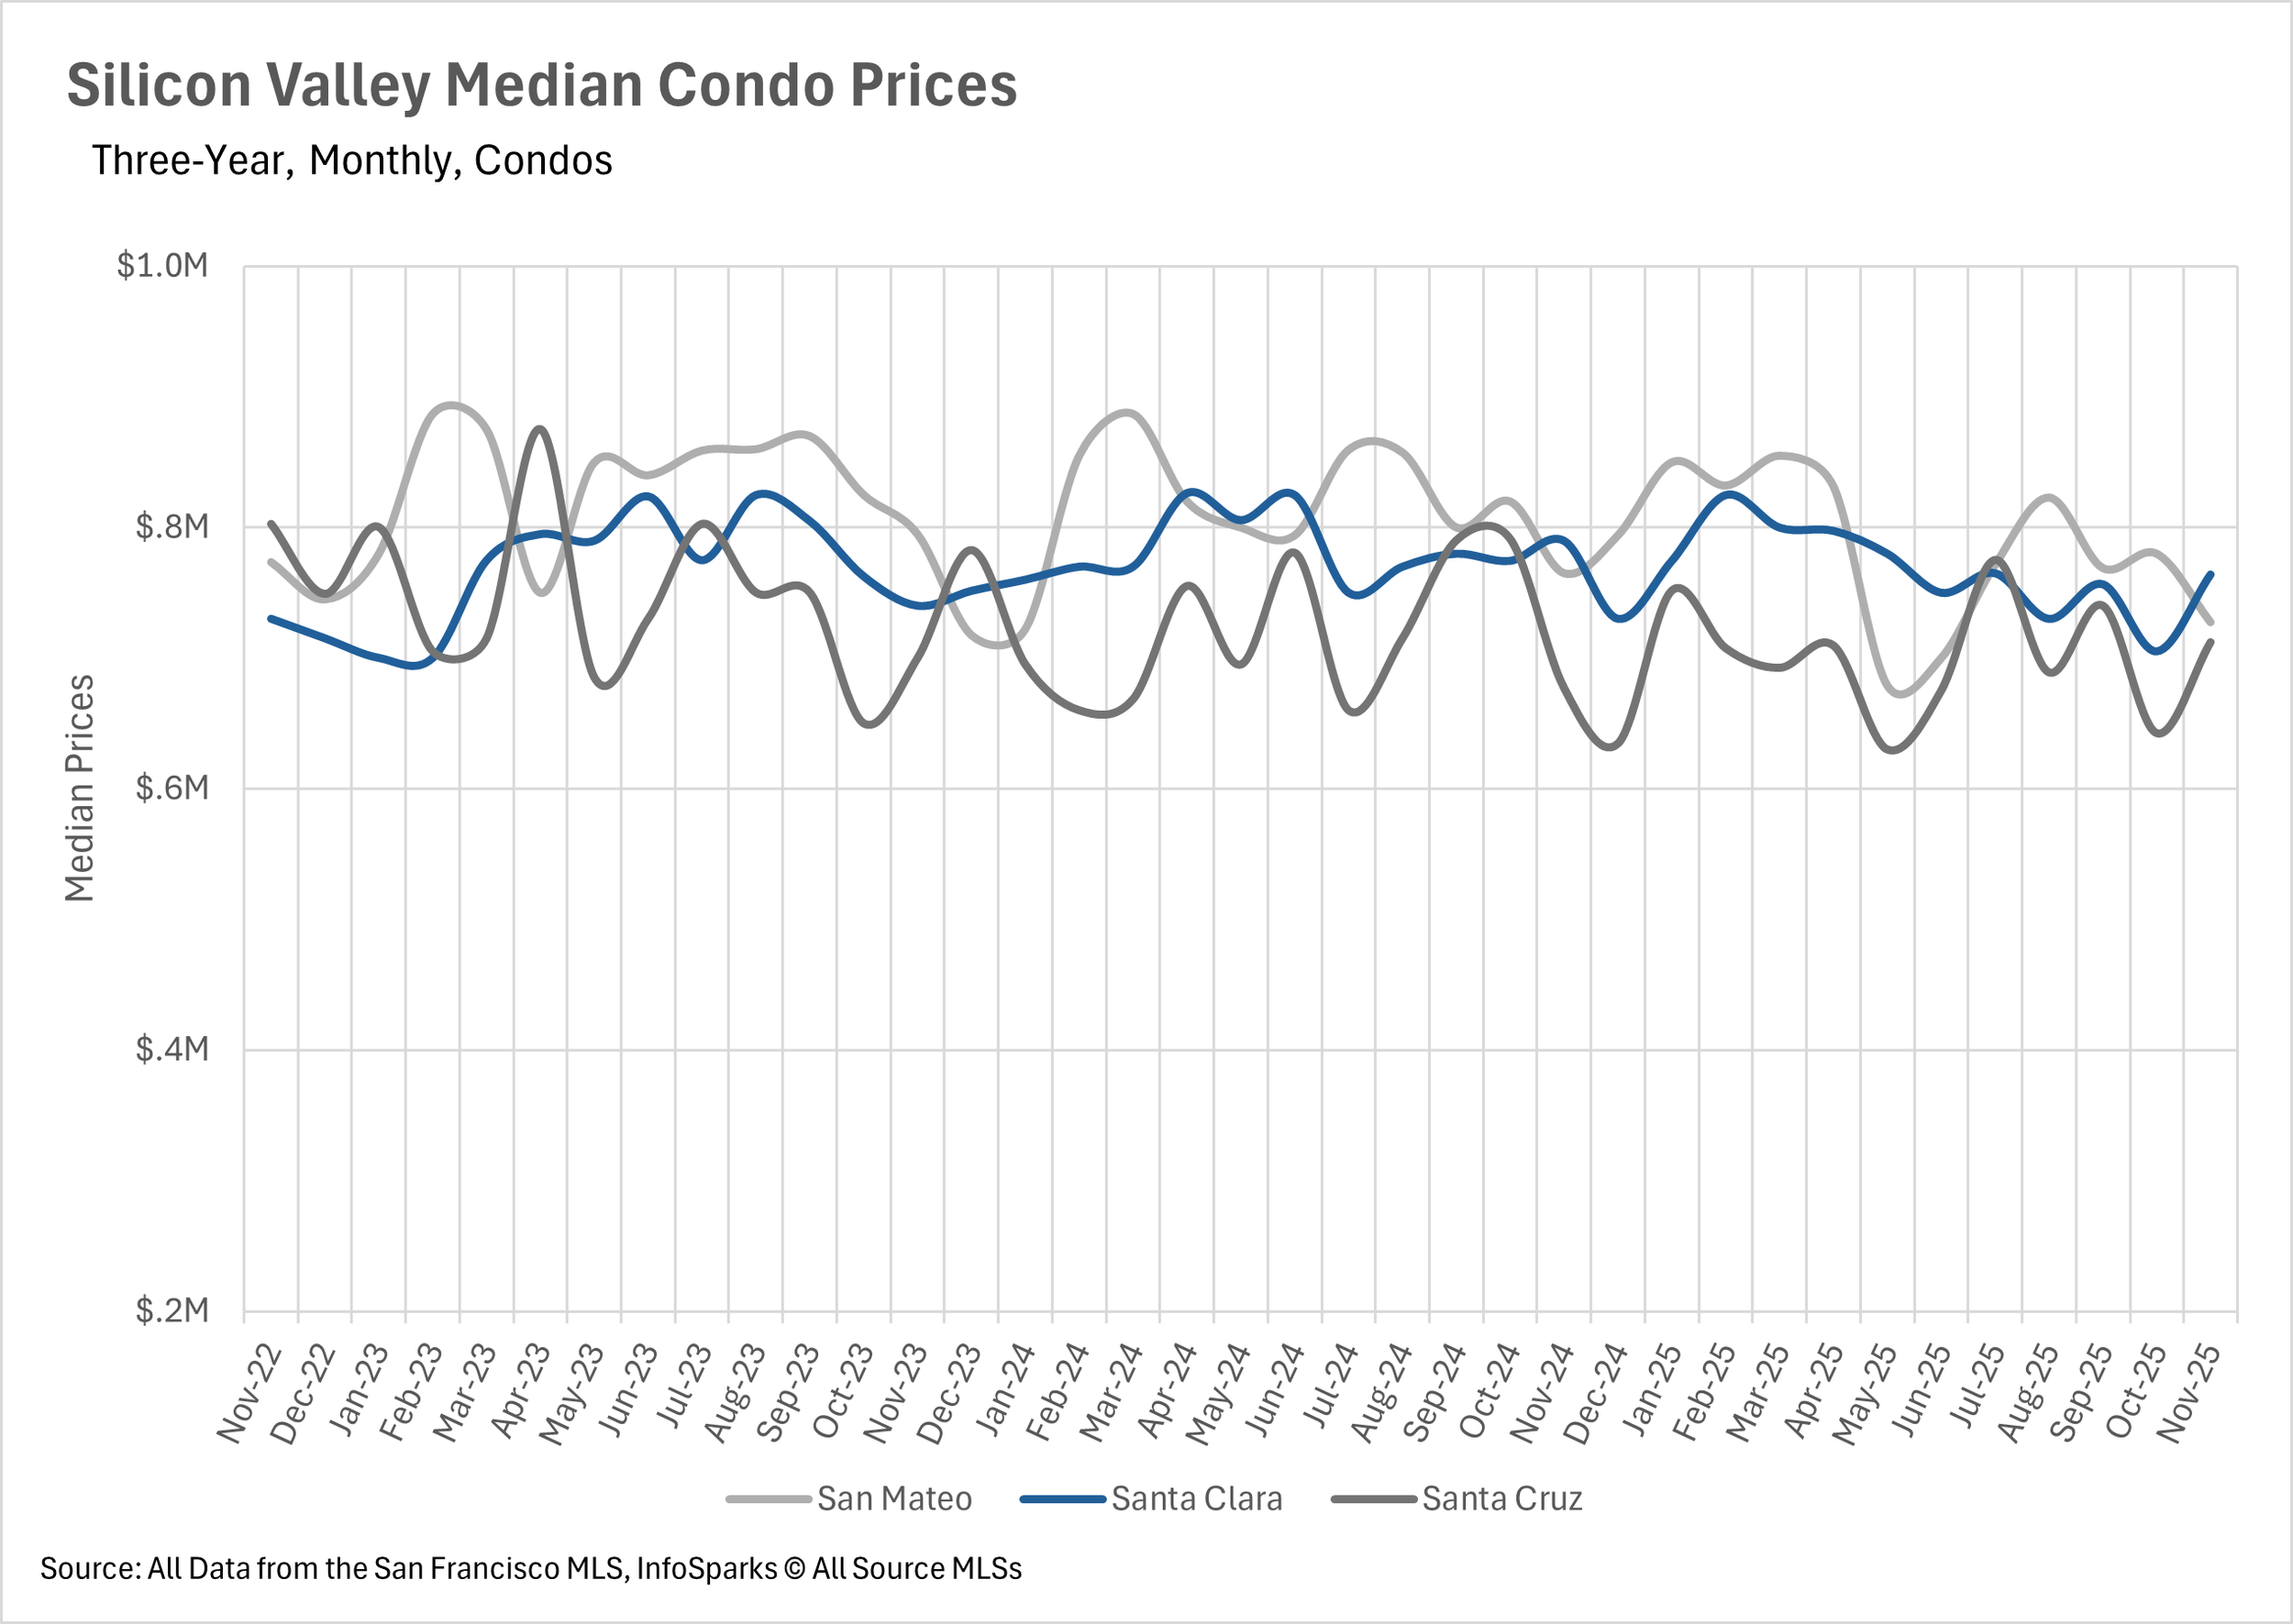
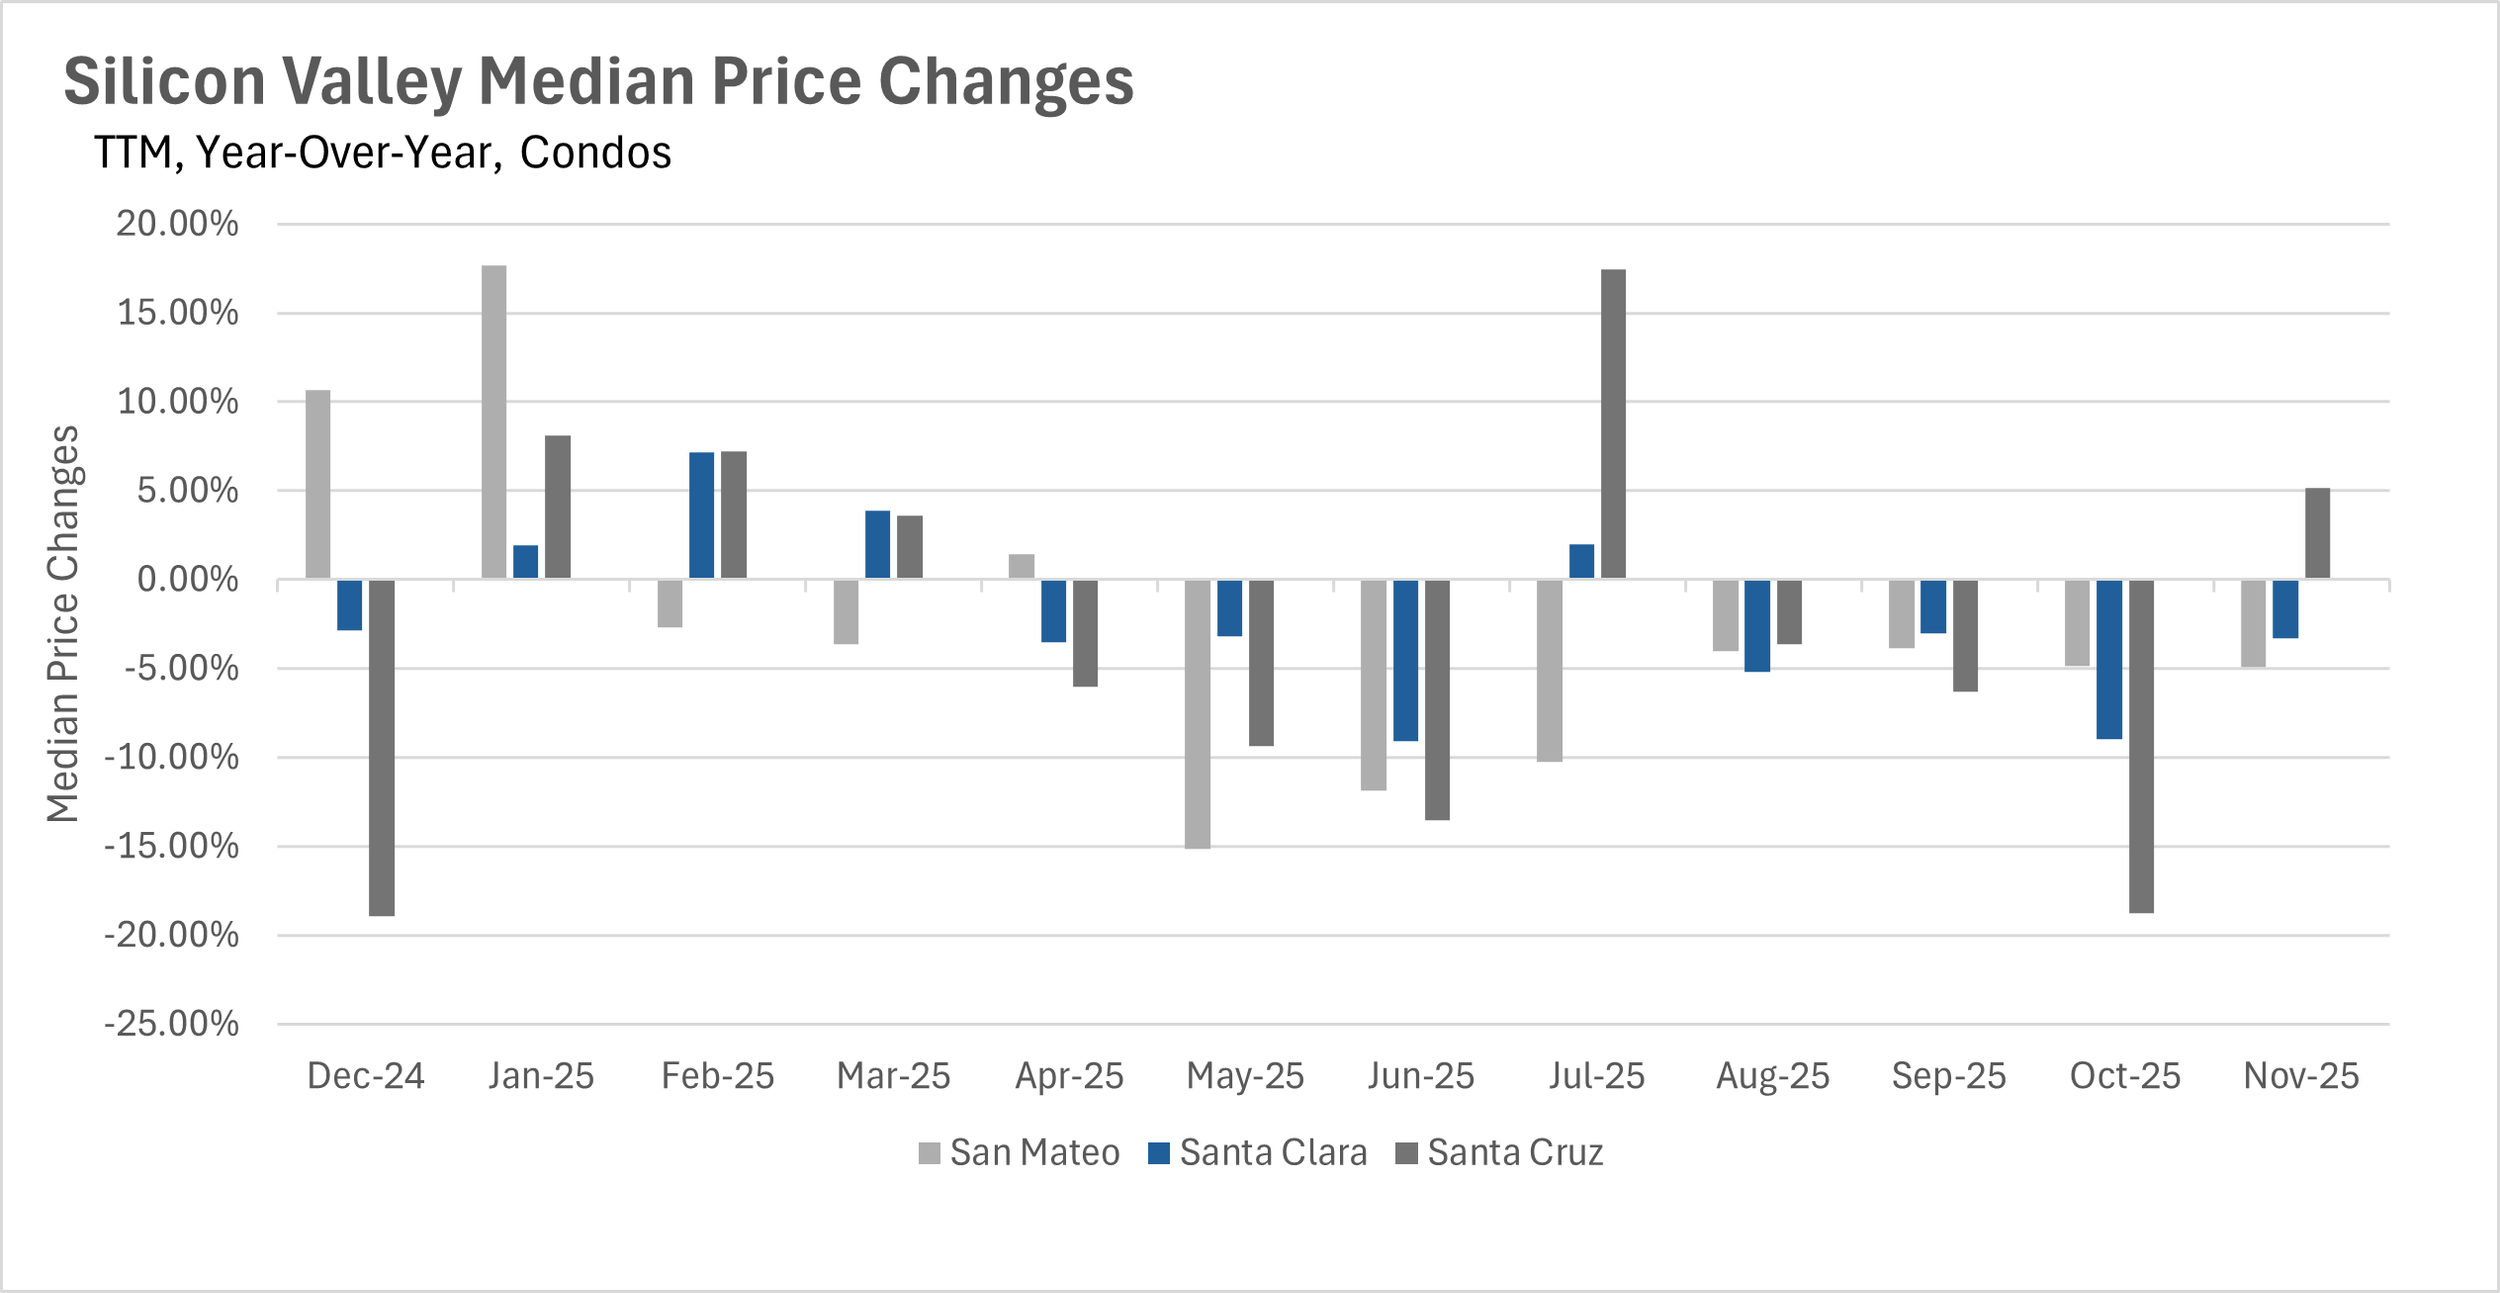
Traditionally, the single-family home market in Silicon Valley is one of the strongest markets in the country! This means that it’s quite rare to see year-over-year price declines in every single county within the region. Unfortunately, though, that’s exactly what we saw this month. Median sale prices decreased by 0.16%, 1.18%, and 5.06% in Santa Clara, Santa Cruz, and San Mateo Counties, respectively. When we turn to the condo market, we saw median sale prices decrease by 3.28% and 4.90% in Santa Clara and San Mateo Counties, while they increased in Santa Cruz County by 5.17% on a year-over-year basis.
Single-family home inventories have overcorrected since their summer highs
Like much of the state of California, throughout the late spring and early summer, inventories began to build at an incredibly rapid pace in Silicon Valley. While many thought that we may see the market return to healthier levels of inventory in the long term, unfortunately that’s not the case. In the month of November, we saw single-family inventories overcorrect in a huge way, dropping by nearly 30% on a month-over-month basis, and just over 10% on a year-over-year basis. In fact, inventory levels for single-family homes are nearing where they were at the lows of December last year! However, when we turn to the condo market, inventory levels are effectively flat year-over-year, with a slight 1.11% increase.
Santa Cruz County single-family homes spent 109.52% more time on the market than last year
While you might expect inventories to move more quickly when there’s a huge dropoff, that wasn’t the case in the single-family home market. Admittedly, it’s very difficult for inventories to move faster than they already are in San Mateo and Santa Clara Counties, as the average home is sold in two weeks or less. However, things seem to have gone sideways in Santa Cruz County, where the average single-family home is spending 109.52% more time on the market than it did this time last year!
The seasonal shift toward a seller's market
When determining whether a market is a buyers’ market or a sellers’ market, we look to the Months of Supply Inventory (MSI) metric. The state of California has historically averaged around three months of MSI, so any area with at or around three months of MSI is considered a balanced market. Any market that has lower than three months of MSI is considered a sellers’ market, whereas markets with more than three months of MSI are considered buyers’ markets.
Seasonally, we always see a shift toward a seller's market as we near winter, as fewer people want to move in colder months or during the holidays, and this year is certainly no exception. The single-family home market has 1.1, 0.9, and 3 months of inventory in San Mateo, Santa Clara, and Santa Cruz Counties, respectively. Whereas the condo market has 2.5, 2.9, and 3.9 months of inventory on the market in San Mateo, Santa Clara, and Santa Cruz Counties, respectively.